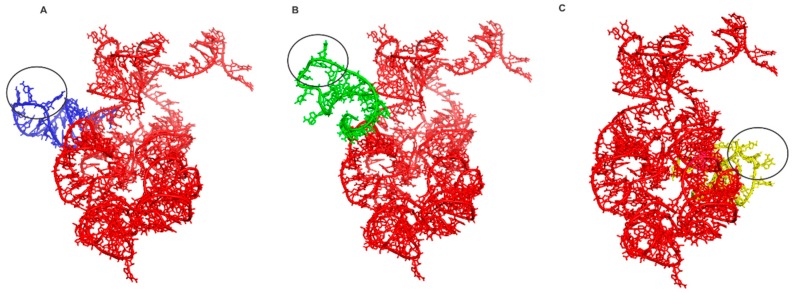
Figure 2.
The docking experiments results. In red the ancestral PTC. In (A) the tRNAGly anticodon loop and PTC (eForce = −1929.96 KJ/mol), in (B) tRNAArg anticodon loop and PTC (eForce = −26017.11 KJ/mol) and in (C) tRNAAsp anticodon loop and PTC (eForce = −5100.29 KJ/mol). The black circle indicates the anticodon.

