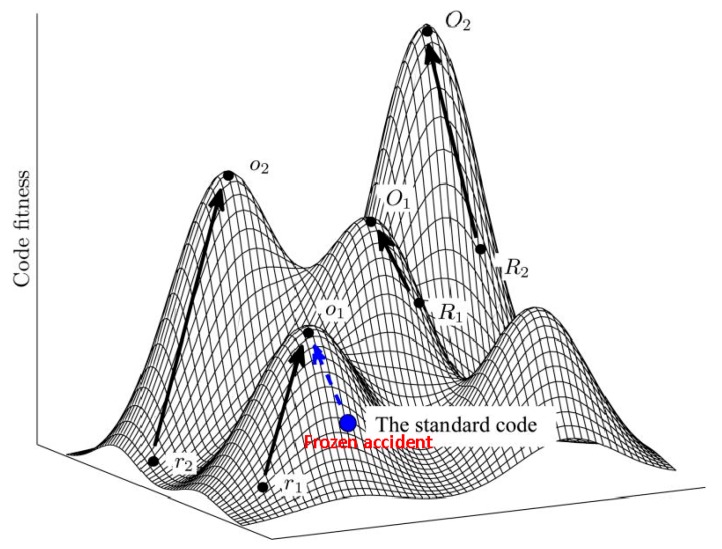
Figure 1.
The code fitness landscape. The figure is a cartoon illustration of peaks of different heights separated by low fitness valleys on the code fitness landscape. The summit of each peak corresponds to a local optimum (O). Evolution towards local peaks is shown by arrows and starts either from a random code (R) or from the SGC. Modified from [14], under Creative License.

