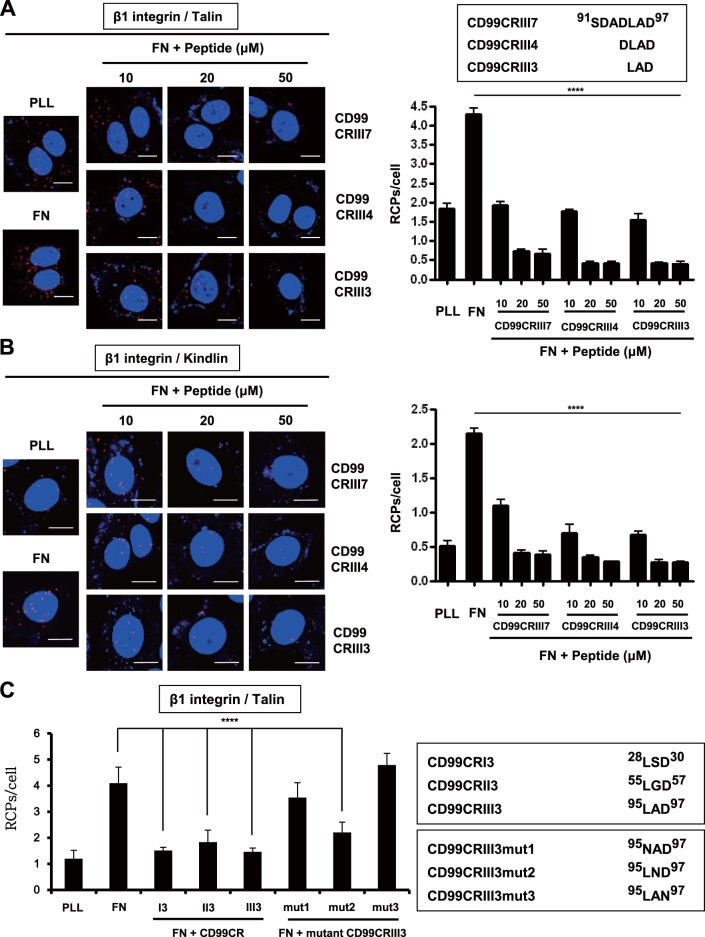
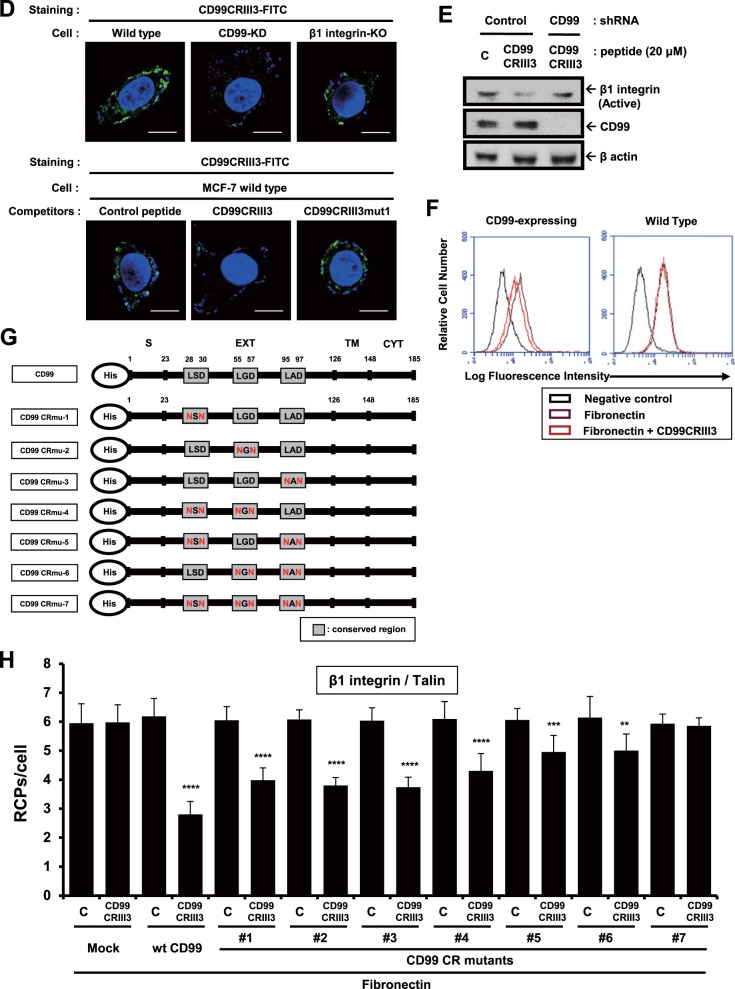
FIG 3.
Functional analysis of highly conserved regions of CD99 in the regulation of β1 integrin activity. (A, B) A 7-mer peptide was shortened by either 4-mer or 3-mer. Cells were seeded onto PLL- or fibronectin (FN)-coated coverslips and treated with three different sizes of peptides for 1 h as indicated. In situ PLA was performed to determine the interaction of talin or kindlin with β1 integrin. (C) Cells were treated with three different 3-mer peptides (20 μM) that originated from three different conserved regions, as well as mutated forms of CD99CRIII3. The interaction between talin and β1 integrin was confirmed by in situ PLA. (D) To determine the receptor-specific binding of CD99CRIII3, wild-type, CD99 knockdown, or β1 integrin knockout MCF-7 cells were stained with FITC-conjugated CD99CRIII3 and then observed under a confocal microscope. Unconjugated peptides (control, CD99CRIII3, and CD99CRIII3mut1) were used as competitors. (E) Cells were treated with CD99CRIII3 for 1 h, and cell lysates were subjected to SDS-PAGE to analyze β1 integrin activity. (F) CD99-deficient human keratinocytes, HaCaT cells, were infected with a retroviral vector carrying wild-type CD99 cDNA and seeded into 35-mm dishes coated with fibronectin. After treatment with CD99CRIII3, β1 integrin activity was analyzed by flow cytometry with a BD Accuri C6 system. (G, H) Wild-type CD99 and a series of variant cDNA constructs of CD99. Each of the cDNA constructs was inserted into a pMSCV retroviral vector containing a neomycin resistance gene. The β1 integrin-talin interaction was examined by in situ PLA. (A to C, H) Nuclei were stained with 4′,6-diamidino-2-phenylindole (DAPI; blue). Red spots indicate the physical connection of the target molecules. PLA signals in cell populations (n = 8) were quantified by NIS Elements analysis. The average number of rolling-circle products (RCPs) per cell ± the standard error is shown. Asterisks represent statistically significant differences from untreated cells as follows: **, P < 0.01; ***, P < 0.001; ****, P < 0.0001. Magnification, ×600. Scale bars = 10 μm. wt, wild type.


