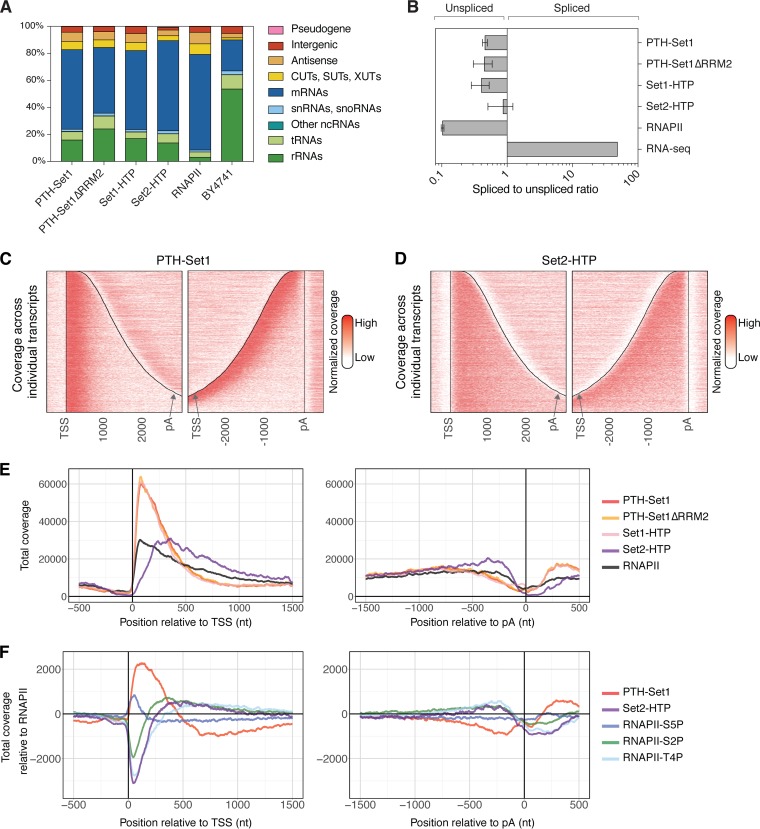
FIG 2.
Set1 is enriched near the TSS, while Set2 binds across nascent RNAPII transcripts. (A) Distribution of reads across transcript classes in the CRAC data sets. Replicates have been averaged. Rpo21-HTP represents RNAPII. (B) Relative recovery of spliced mRNAs versus unspliced pre-mRNAs, expressed as a ratio of RNA fragments spanning exon-exon junctions to those spanning intron-exon and exon-intron junctions. Error bars represent standard deviations from the replicates listed in Table S1 in the supplemental material. (C and D) Distribution of PTH-Set1 (C) and Set2-HTP (D) across individual mRNAs in reads per million of RNAPII transcripts. Transcripts are aligned to the TSS (left) and the pA site (right), respectively. Distances are indicated in nucleotides. The corresponding total coverages are shown in panel E. (E) Metagene analysis of PTH-Set1, PTH-Set1ΔRRM2, Set1-HTP, Set2-HTP, and RNAPII (Rpo21-HTP) across mRNAs, in reads per million of RNAPII transcripts. Transcripts are aligned to the TSS (left) or the pA site (right). (F) Metagene analysis of PTH-Set1, RNAPII-S5P, Set2-HTP, RNAPII-S2P, and RNAPII-T4P enrichment relative to total RNAPII, across mRNAs aligned to their TSS (left) or pA site (right). Relative enrichment was calculated as log2(protein coverage/total Rpo21-HTP coverage). The enrichment across individual mRNAs is shown in Fig. S3E and S3F for PTH-Set1 and Set2-HTP.

