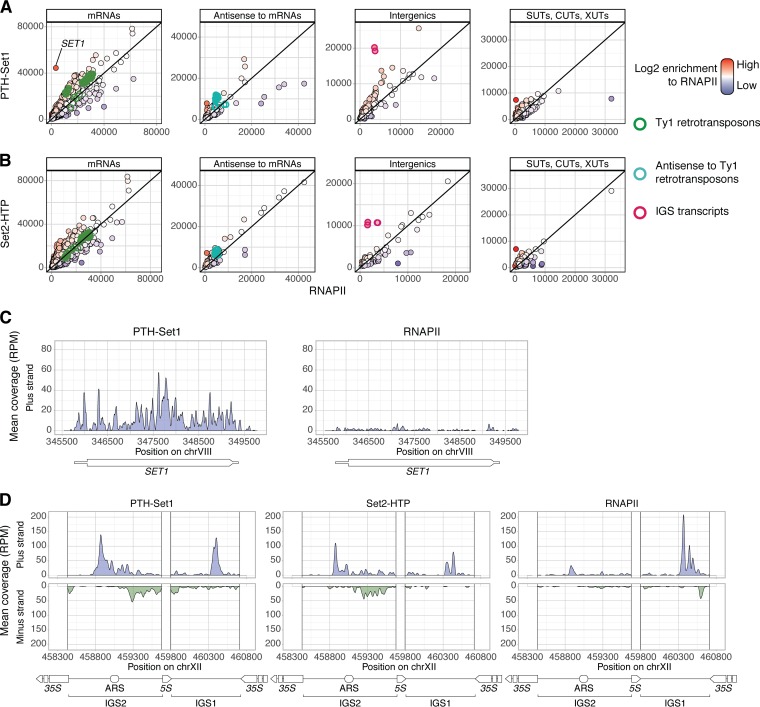
FIG 3.
Some transcripts show high enrichment for Set1 or Set2 relative to RNAPII. (A and B) PTH-Set1 (A) or Set2-HTP (B) coverage over genomic features (mRNAs, transcripts antisense to mRNAs, intergenic transcripts, SUTs, CUTs, and XUTs) is plotted against RNAPII coverage (Rpo21-HTP). The fill color of the points represents the enrichment for Set1 or Set2 relative to RNAPII. Some classes of transcripts are highlighted, as indicated on the right. Other RNA classes are shown in Fig. S5C in the supplemental material. (C and D) Coverage, in reads per million (RPM) of RNAPII transcripts, at loci where Set1 is enriched over RNAPII. (C) SET1 locus. The transcription unit is represented under the plots, with the thicker box corresponding to the coding sequence. (D) A rDNA intergenic spacer (IGS) region. rRNA genes appear white on the plots.

