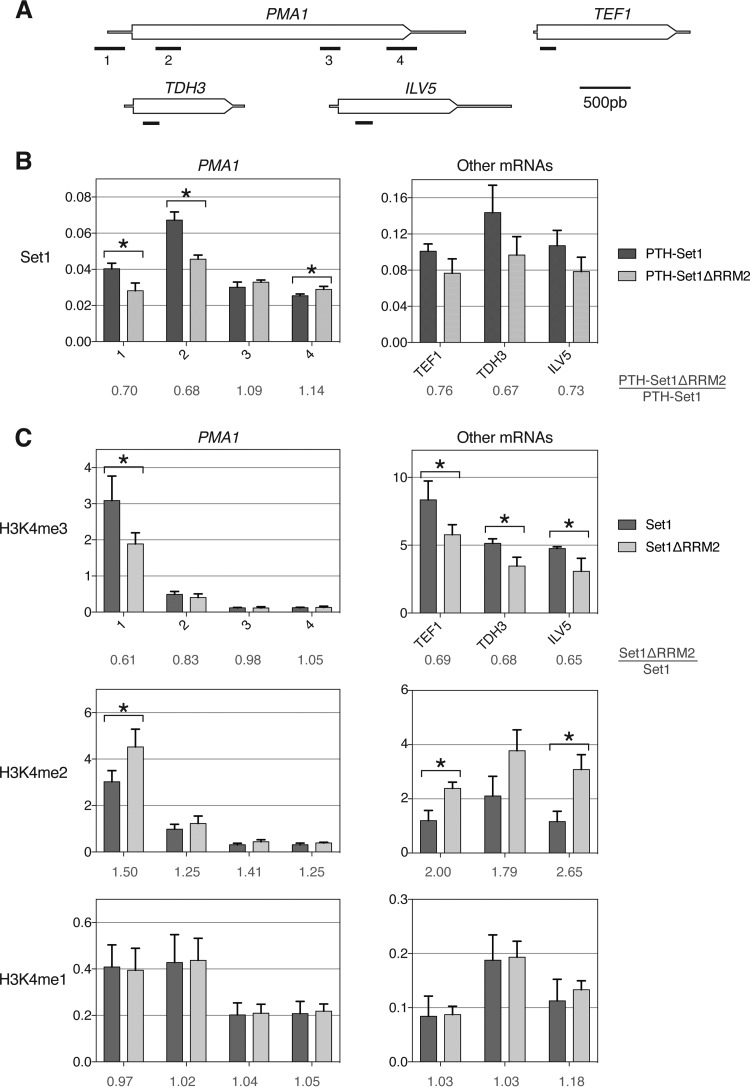
FIG 4.
RNA binding stabilizes interactions of Set1 with chromatin. (A) Schematic representation of the genes analyzed. The transcription unit is represented, with the coding sequences being thicker. Bars indicate PCR products. (B) Set1 ChIP in the PTH-Set1 and PTH-Set1ΔRRM2 strains. Associated DNA was analyzed by qPCR, and the signal is expressed as a percentage of the input DNA. Error bars represent the standard deviations from biological triplicates. * indicates a different signal with a P value of <0.05, calculated with Student's t test. (C) H3K4me3, H3K4me2, and H3K4me1 ChIP in the wild-type and Set1ΔRRM2 strains. The signal is normalized to the total H3 signal. Error bars represent the standard deviations from biological triplicates. * indicates a different signal with a P value of <0.05, calculated with Student's t test.

