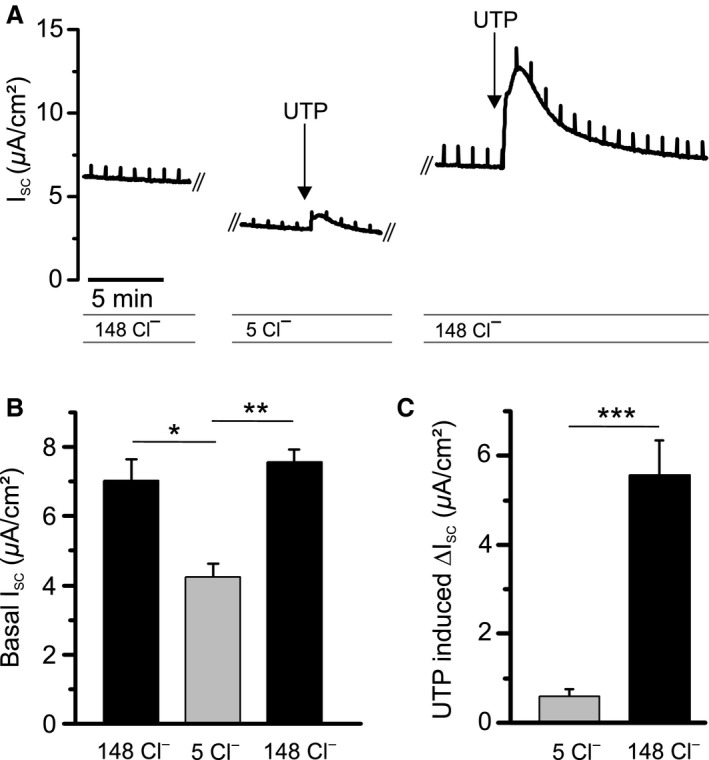
Figure 3.

Cl−‐dependence of UTP‐induced ΔI SC responses in RTEC monolayers. (A) Representative I SC trace demonstrating the effect of Cl− substitution by gluconate on basal I SC as well as on the UTP‐induced ΔI SC response. Cl− concentrations are indicated in mmol/L. (B) Statistical summary of basal I SC upon reducing Cl− concentrations on both sides of the monolayer, and recovery upon return to high Cl− solution. (C) Statistical summary of the effect of Cl− substitution on the UTP‐response. All results are means ± SEM (n = 4 primary cultures). *P < 0.05, **P < 0.01, ***P < 0.001 (two tailed) between cultures exposed to test compounds and controls.
