Figure 5.

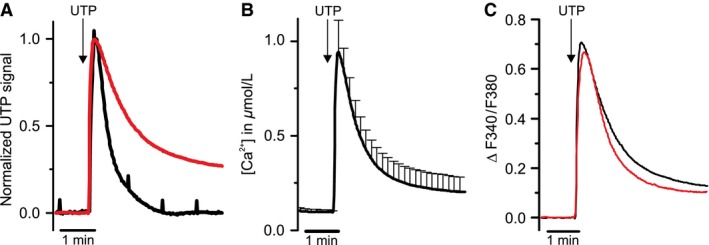
Intracellular Ca2+‐release during UTP stimulation in RTEC cultures. (A) Comparison of the time course of UTP‐induced Ca2+ signals recorded from RTEC cultures (red trace, normalized averaged traces from 4 primary cultures) with a representative UTP‐induced ΔI SC signal recorded from RTEC cultures in the Ussing chamber (black trace). (B) Calibrated Ca2+ imaging traces from RTEC cultures visualize the intracellular Ca2+ concentration during stimulation with UTP (100 μmol/L) (mean ± SEM, averaged traces from 4 primary cultures). (C) Comparison of the intracellular Ca2+‐response of RTEC cultures during UTP‐stimulation with (red trace) and without (black trace) Ani9 (10 μmol/L) (averaged traces from 4 primary cultures).
