Figure 6.

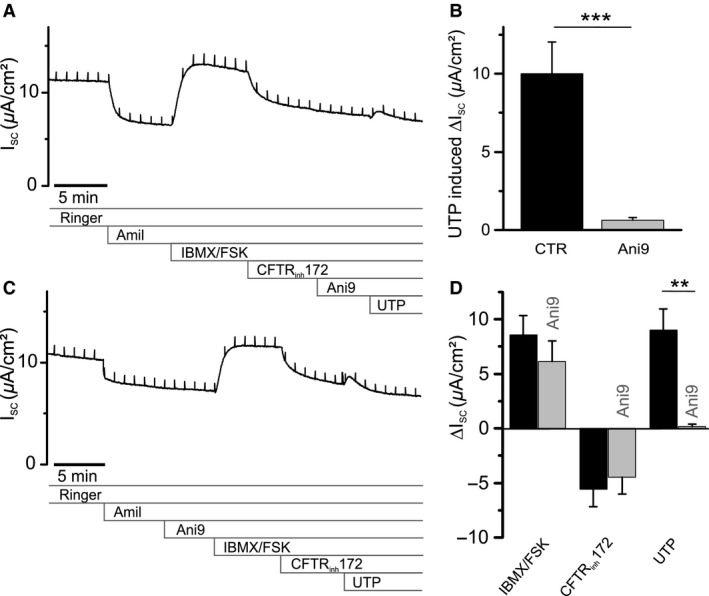
Pharmacological identification of Ca2+‐dependent Cl− channels mediating UTP response in RTEC cultures. (A) Representative I SC recording from an RTEC monolayer, with Ani9 (10 μmol/L) applied to the apical solution 5 min before stimulation with UTP (100 μmol/L). (B) Statistical summary of (A) and control experiments without Ani9, illustrating blocking efficiency of 10 μmol/L Ani9 on the UTP response (n = 7 primary cultures). (C) Representative I SC recording with 10 μmol/L Ani9 applied to the apical solution 5 min before stimulating the RTEC monolayer with IBMX/FSK, applying the protocol depicted in Fig. 2A. (D) Statistical summary of (C) and control experiments without Ani9, to show ΔI SC responses of RTEC monolayers to the application of IBMX/FSK, CFTRinh172 and UTP in the presence of 10 μmol/L Ani9 (n = 5 primary cultures). All results are means ± SEM. *P < 0.05, **P < 0.01, ***P < 0.001 (two tailed) between cultures exposed to test compounds and controls.
