
Figure 6.
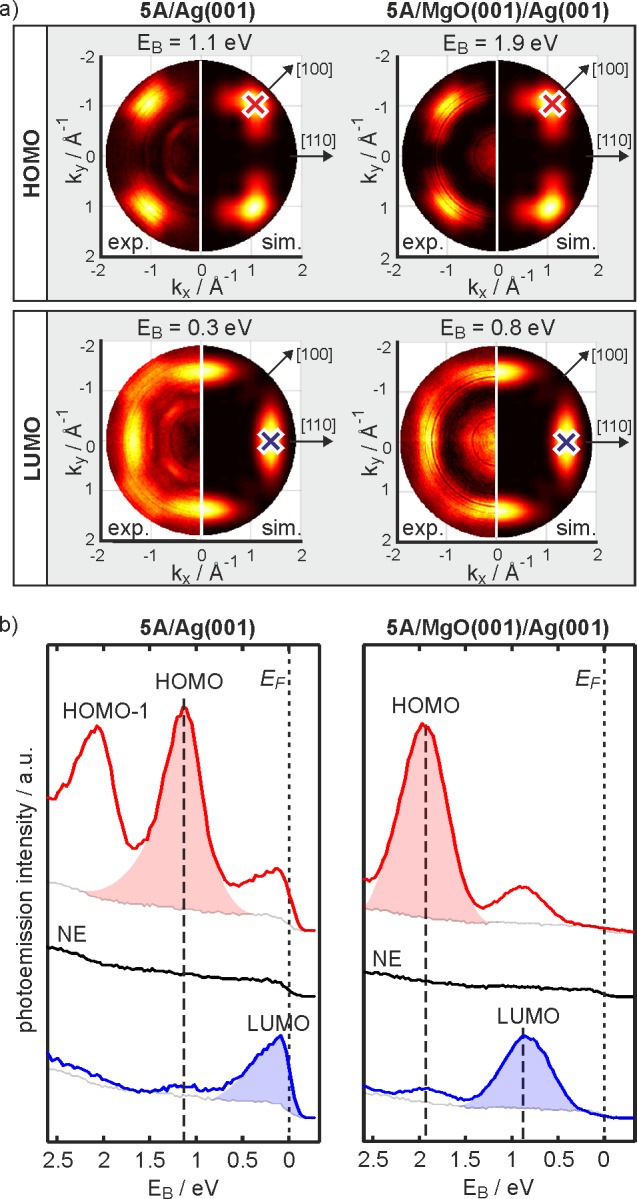
ARPES of 5A monolayer coverage on Ag(001) (left column) and on 2 ML MgO(001)/Ag(001) (right column). (a) Momentum maps of the HOMO (top row) and the LUMO (second row) emission features. Theoretical results for two isolated 5A molecules with perpendicular orientations (right halves of momentum maps) are compared to the experimentally obtained data (left halves of momentum maps) at the stated binding energies, EB. (b) ARPES spectra of 5A/Ag(001) (left column) and 5A/MgO(001)/Ag(001) (right column) measured at k positions of the HOMO(red)/LUMO(blue) intensity maxima in the momentum maps (depicted as red/blue crosses in panel (a)). Normal emission (NE) spectra are shown for comparison (black). The peak areas of the HOMO/LUMO emission features are depicted as red and blue shadings.