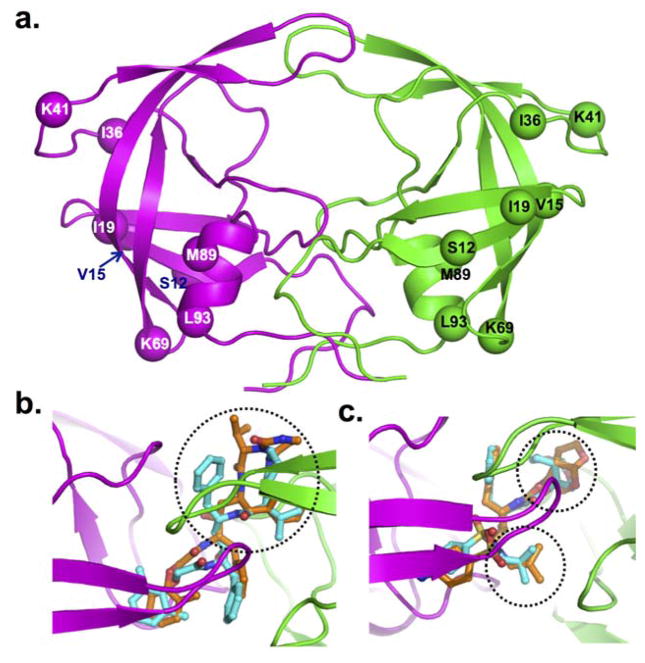
Figure 4. Molecular model of HIV-1C protease dimer.
The backbone of protease is shown in secondary structure representation: α-helices as helical ribbon, β strands as flat arrows, and unordered structure as thin tubes (A). The two dimers are coloured magenta and green. The Cα atoms of the residues that are not conserved between HIV-1B and HIV-1C proteases are shown as solid balls. Superposition in HIV-1B and HIV-1C is shown for lopinavir (B) and darunavir (C). The protease inhibitors are rendered in balls-and-stick (cyan carbons in HIV-1B, and orange carbons in HIV-1C) in two proteases. The other atoms are coloured by atom type (red for oxygen, blue for nitrogen, and yellow for sulphur). The ribbon diagram shows the backbone of HIV-1C proteases. The difference in conformation of different moieties for the drugs in the two proteases is circled by dotted lines.

