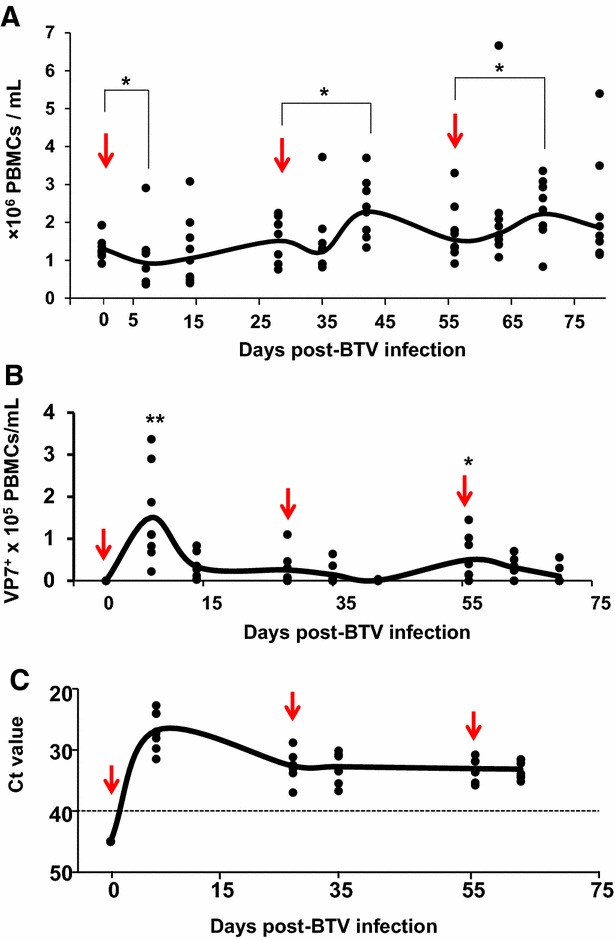
Figure 2.

Expansion of PBMC and viral load during acute and recall BTV infection. Sheep were inoculated with BTV-8 three times at 28 day intervals (see “Materials and methods” section) and bled at different times post-inoculation. A Average count of PBMC relative to pre-BTV infection at different days post-inoculation. The arrow indicates the inoculation day. * p < 0.05; Mann-Whitney test (timepoint vs inoculation time). B Number of PBMC/mL of blood that were positive for VP7 by flow cytometry staining at different days post-BTV infection. Arrows indicate inoculation days. * p < 0.05, ** p < 0.01; Mann–Whitney test (timepoint vs day 0). C Whole blood was collected at different days post-BTV infection. Total RNA was extracted and RT-qPCR for BTV segment 5 was performed as indicated in the “Materials and methods”. The results are expressed as Ct. The cut-off is indicated with a dotted lined (Ct = 40 according to [22]).
