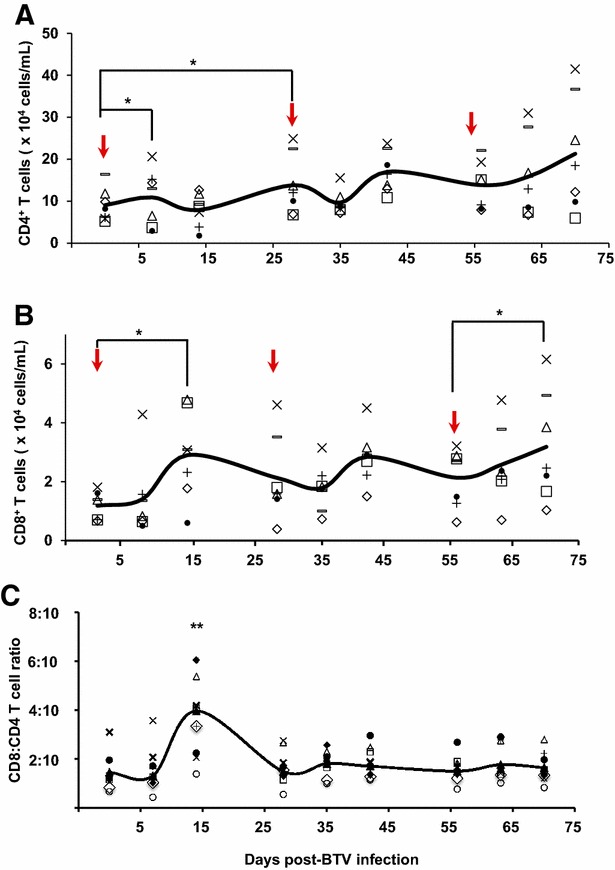
Figure 3.

CD4 + and CD8 + T cell expansion during acute and recall BTV infection. PBMC were obtained at the indicated time points after primary, secondary or tertiary BTV infection (indicated by an arrow) and staining for CD4 and CD8-T cell was done by flow cytometry (see “Materials and methods”). A Number of CD4+-T cells over time in PBMC of individual sheep. * p < 0.05; Mann-Whitney test (timepoints vs inoculation time). B Number of CD8+-T cells in PBMC over time of individual sheep. * p < 0.05; Mann-Whitney test (time points vs inoculation time). C Kinetics of specific CD8:CD4 T-cell ratio. The number of CD8+ T cells was divided by the number of CD4+ T-cells during the time course of infection. ** p < 0.01; Mann-Whitney test (day 14 vs all timepoints).
