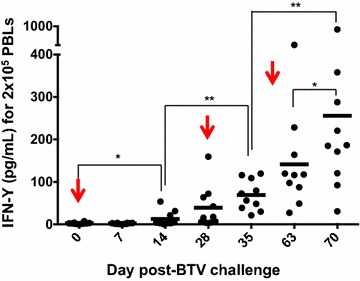
Figure 4.

Kinetics of IFN-γ production by activated T cells. PBMC from BTV-infected sheep were stimulated with BTV-BEI inactivated (see “Materials and methods” section) and the amount of IFN-γ produced was evaluated by ELISA. The arrows indicate days of BTV inoculation. * p < 0.05, ** p < 0.01; Mann-Whitney test.
