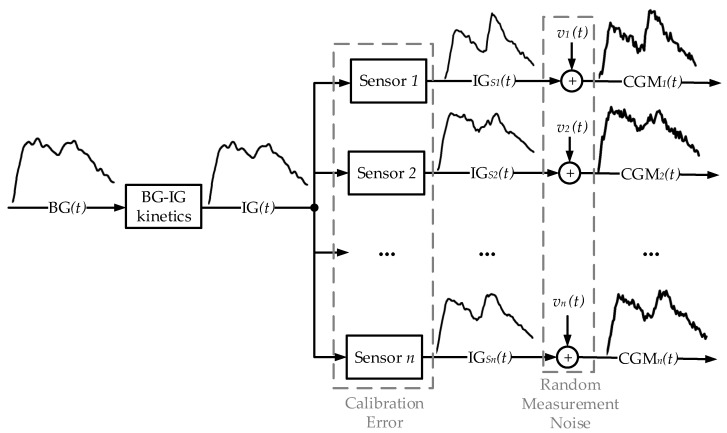
Figure 2.
Description of how n parallel CGM signals are modeled. From left to right: transformation of the blood glucose (BG) signal into the interstitium glucose (IG) signal (BG-IG kinetics). Then, each of the n CGM sensors measures the IG signal, generating the IG profile, which is susceptible to calibration error. Finally, the measured CGM is subject to random measurement noise, .

