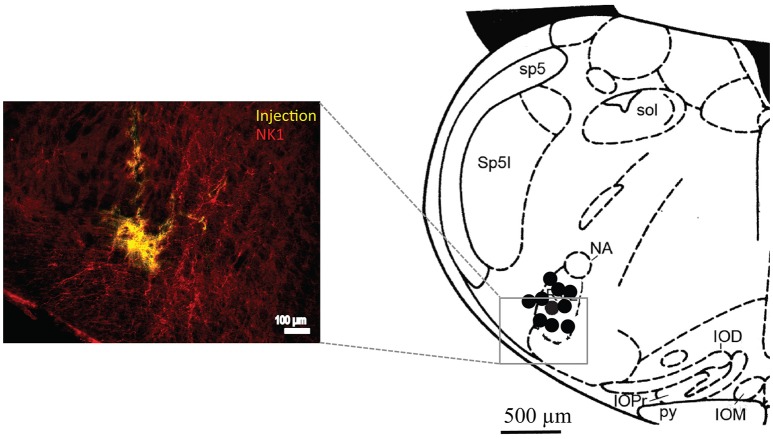
Figure 6.
Immunohistochemical analysis of brainstem tissue sections confirm injection sites within the preBötC. Left side, a fluorescent image showing an injection site in the preBötC surrounded by red NK1 receptor immunofluorescence. The right side shows a schematic of a coronal section of the brainstem at the level of the preBötC showing sites of the AOAA microinjections (black dots). sol, solitary tract; sp5, spinal trigeminal tract; Sp5l, spinal trigeminal nucleus, interpolar part; NA, nucleus ambiguus; IOD, inferior olive, dorsal nucleus; IOM, inferior olive, medial nucleus; IOPr, inferior olive, principal nucleus; py, pyramidal tract.

