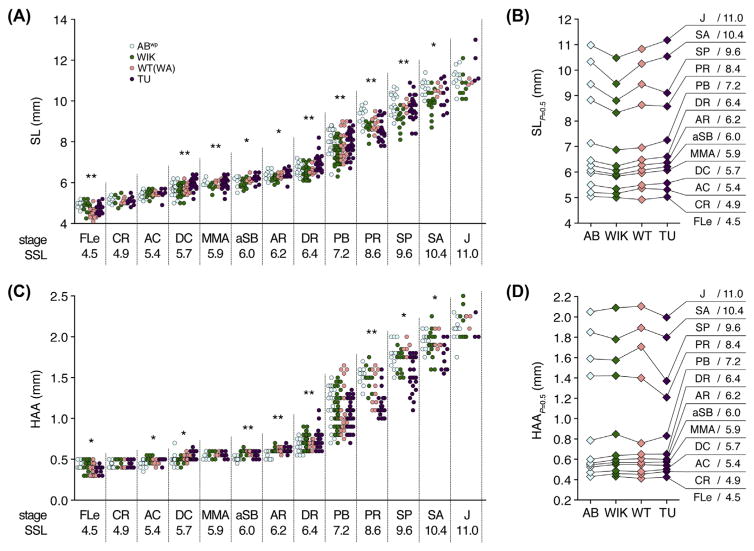
FIGURE 3. Variation in size–stage relationships across wild-type stocks.
(A, C) Stages attained by fish of different SLs (A) or HAAs (C). Named stages and SSLs are indicated on Y-axes. Asterisks within each stage indicate size heterogeneity among stocks (P < 0.05: **, with Bonferroni correction; *, only without Bonferroni correction). (B, C) Sizes at which 50% of individuals are predicted to have transitioned from one stage to the next. Differences in transition probabilities indicate variation in size– stage relationships between strains (B: χ2 = 57.8, d.f. = 30, P < 0.005; D: χ2 = 80.7, d.f. = 30, P < 0.001). Same individuals shown in Fig. 2. (See color plate)

