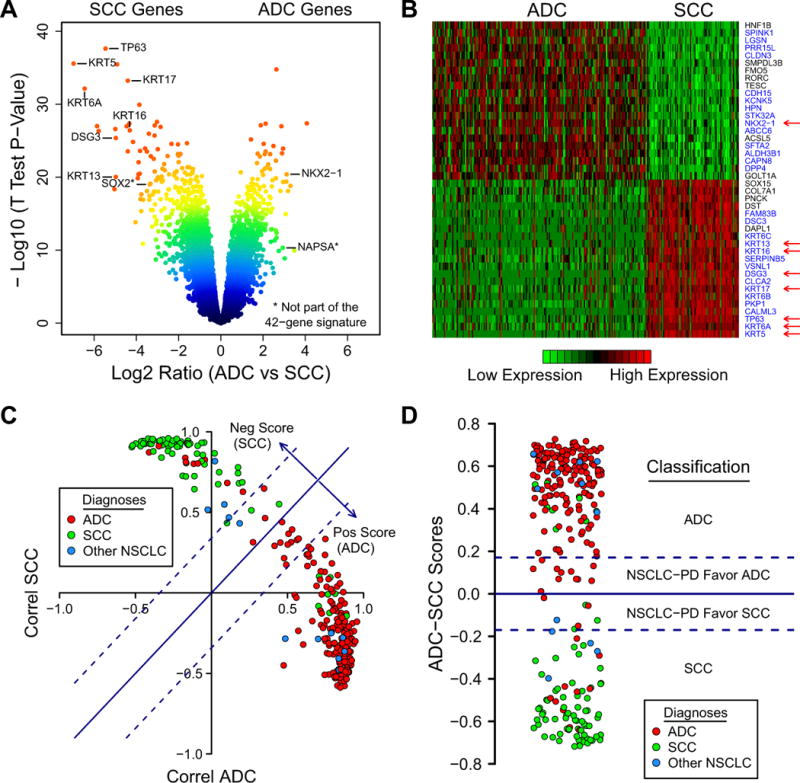
Figure 1.

(A) A volcano plot shows that many genes are significantly different between ADC and SCC. Among these are several genes for immunostains typically used by pathologists, including high molecular weight keratins (KRTs), TP63, DSG3, and TITF1 (NKX2-1). Color-coding is related to the distance of each point to the plot’s origin and shows significance levels (red: highly significant). (B) Heatmap of ADC-SCC signature in the MDACC dataset. Red, high mRNA expression; green, low mRNA expression. Twenty-one genes overexpressed in ADC and twenty-one genes overexpressed in SCC were selected for this signature. Blue labels, genes known to be relevant to lung cancer pathogenesis. Arrows, commonly used immunostains; (C) “Correlation plot” where each point represents the Pearson correlation values between the 42-gene signature expression of individual samples and the mean expression of ADCs (x-axis) and SCCs (y-axis). The scores shown as arrows are defined as (Correl ADC − Correl SCC)/2. They are proportional to the distances from each point to the line y = x. Dotted lines represent cutoff score values below which the samples are thought to be less well-differentiated. Color-coding in this and similar plots represents pathological diagnoses. (D) “Score plot” where the y-axis represents the scores calculated from (C). PD, Poorly Differentiated. Dotted lines are the score cutoffs.
