
Fig. 7.
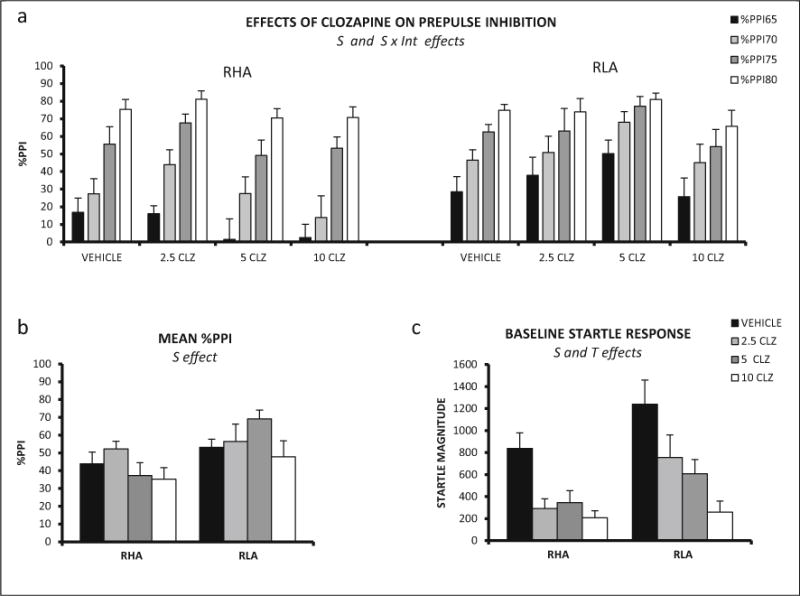
a Mean prepulse inhibition (±SEM) of RHA-I and RLA-I rats is shown for each prepulse intensity and clozapine dose. b Mean prepulse inhibition (averaged for the four intensities ± SEM) is shown for all the treatments in RHA-I and RLA-I rats. c Mean ± SEM baseline startle response for each treatment administered to the RHA-I and RLA-I rats. S strain effect (ANOVA), T treatment effect (ANOVA), S × Int strain × prepulse intensity interaction (ANOVA). The number of rats in each experimental group was as follows: RHA, vehicle, n = 9; 2.5 mg/kg, n = 7; 5 mg/kg, n = 8; 10 mg/kg, n = 8; RLA-I, vehicle, n = 8; 2.5 mg/kg, n = 7; 5 mg/kg, n = 8; 10 mg/kg, n = 8