Fig. 1.

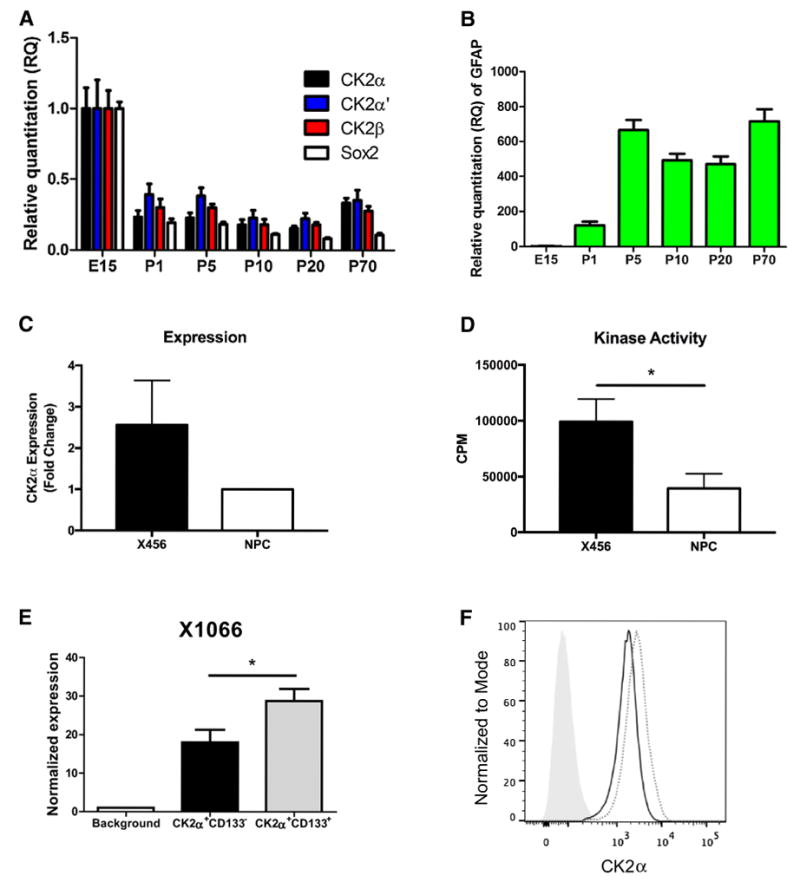
CK2α expression and activity are increased in BTICs. a Expression of CK2 subunits (α, α′, β), SOX2 and b GFAP during murine neurodevelopment. Data represent one mouse per timepoint in replicates of three. c Murine NPCs and human X456 cells were evaluated for CK2α expression by flow cytometry (n = 3). d CK2 kinase activity was assessed in murine NPCs and human X456 cells (n = 3, data represent counts per minute (CPM) with background subtracted for each condition). e CK2α expression in CD133+ and CD133- cells of X1066 xenoline was assessed using flow cytometry (n = 3). f Representative histogram of CK2α expression (gray [solid] represents background control, black line represents CK2α+CD133-, gray [dotted] represents CK2α+CD133+). *p < 0.05
