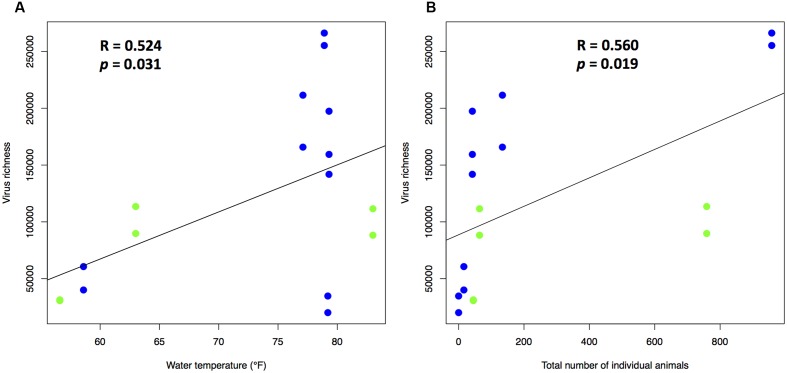
FIGURE 3.
Effect of (A) water temperature and (B) total number of individual animals on virus richness (n = 17). Viral richness estimates were calculated using CatchAll. R was the Pearson correlation coefficient for the virus richness against the variables. Blue and green dots represent seawater and freshwater systems, respectively.

