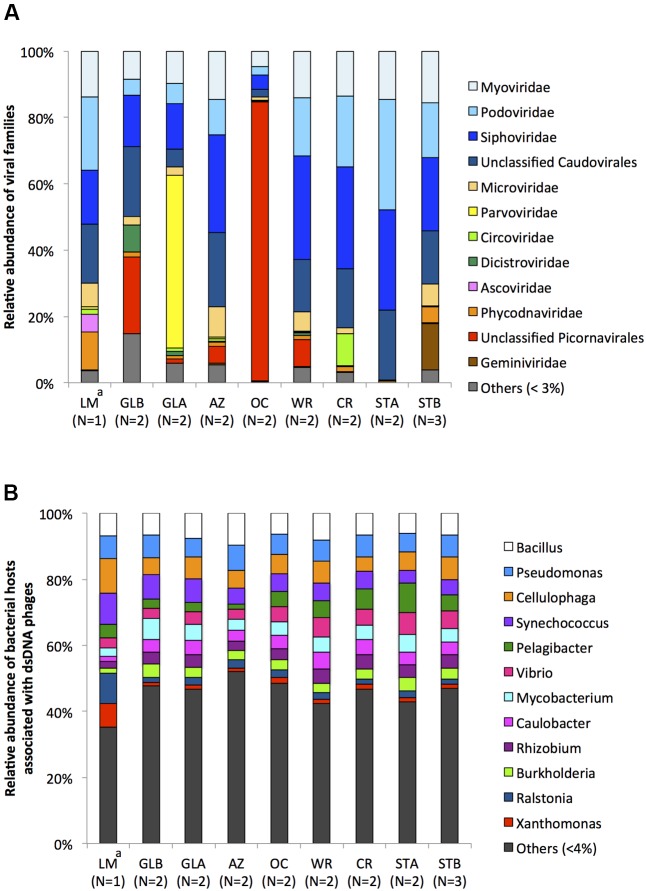
FIGURE 4.
(A) Relative distribution of major viral families of aquarium and Lake Michigan viromes. Abundance was determined by the number of reads against the contigs divided by the contig length, and normalized to 100%. (B) Relative distribution of bacterial hosts associated with dsDNA phages of aquarium and Lake Michigan viromes. Abundance was represented as percentage of number of contigs in each virome. Number of replicates is given in parentheses. LM, Lake Michigan; AZ, Amazon Rising; CR, Caribbean Reef; GLA, Warmer Great Lakes; GLB, Colder Great Lakes; OC, Oceanarium; STA, Stingray Touch before human contact; STB, Stingray Touch after human contact; WR, Wild Reef. aData from Kim et al. (2015)16.

