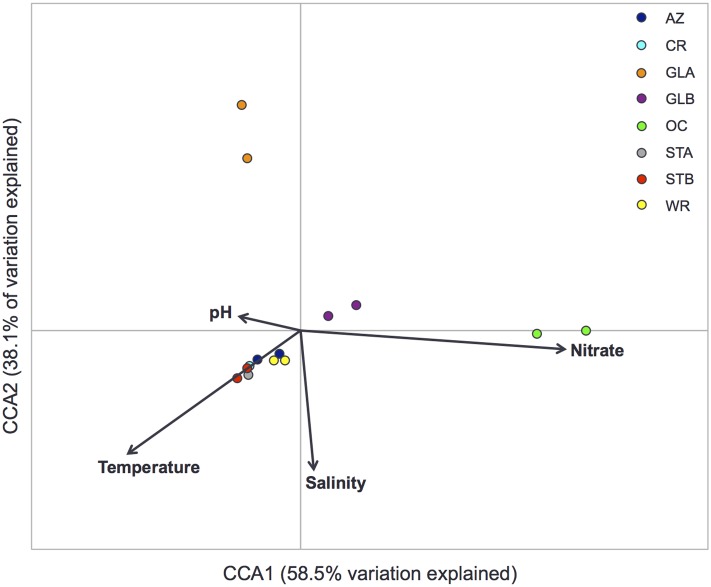
FIGURE 5.
Conocical correspondence analysis (CCA) ordination plot for the first two dimensions to show the relationship between the virome structure (relative abundance of viral families) and physicochemical parameters. Correlations between physicochemical parameters and CCA axes are represented by the length and angle of arrows. AZ, Amazon Rising; CR, Caribbean Reef; GLA, Warmer Great Lakes; GLB, Colder Great Lakes; OC, Oceanarium; STA, Stingray Touch before human contact; STB, Stingray Touch after human contact; WR, Wild Reef.

