
Figure 3.
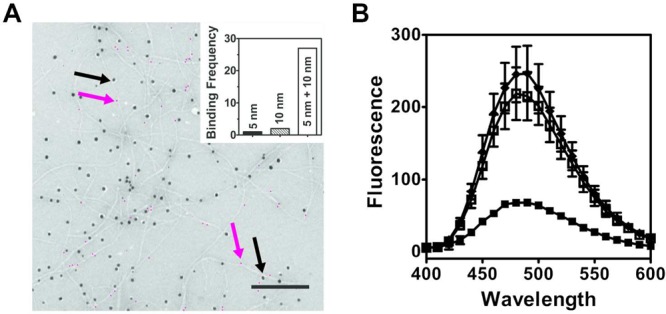
Coassembly of enantiomers MAX1 and DMAX1 is accessed by nanoparticle labeling of peptide fibrils using TEM (A) and fluorescence quenching (B). (A) DMAX1-Biotin and MAX1-Azide peptides were visualized within individual fibrils by the binding of 5 or 10 nm gold nanoparticles, respectively (scale bar = 200 nm). Five nanometer particles are false colored magenta for clarity. Magenta and black arrows indicate examples of bound 5 and 10 nm GNPs, respectively. The original noncolored micrograph is provided as Figure S18E. Inset: frequency of particles binding to distinct individual fibrils (N = 30). (B) Fluorescence spectra of MAX1-EDANS fibrils (◆), MAX1-EDANS fibrils and DMAX1-Dabcyl fibrils formed separately, then mixed (□) and a premixed solution of 1:1 MAX1-EDANS:DMAX1-Dabcyl that was allowed to assemble together (■) (N = 3).