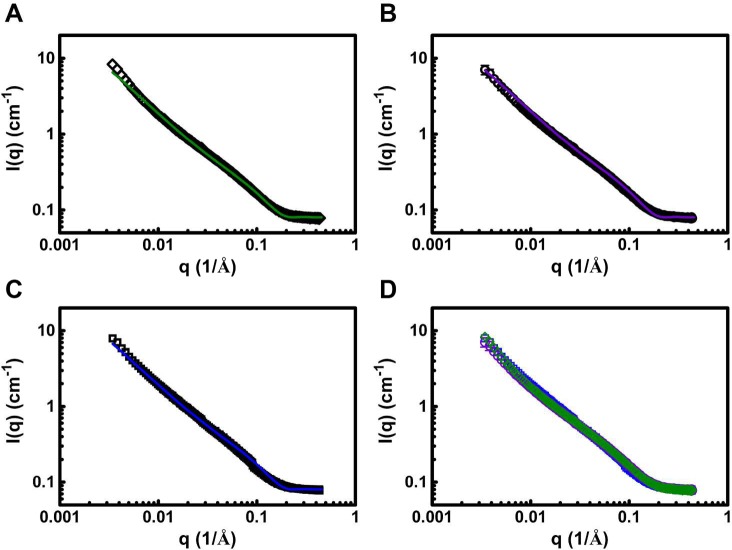
Figure 4.
SANS scattering for 1 wt % hydrogels of pure MAX1, (◇) (A); pure DMAX1, (○) (B); and a mixture of 1:1 MAX1/DMAX1, (□) (C). Each scattering profile is an average of three independent experiments on separate gels performed on separate days. Error bars are smaller than the symbol where not evident. Colored lines represent fractal model fits for the individual hydrogels. (D) Scattering profiles of MAX1 (green), DMAX1 (purple), and racemic (blue) hydrogels are coplotted to emphasize that the enantiomeric assemblies have similar mesh sizes.

