Figure 4.

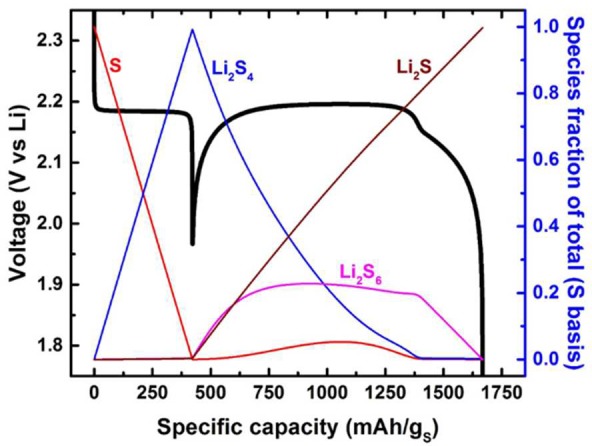
Simulated voltage profile using a kinetic model with a set of rate constants for discharge at the C/30 rate (1C = 1675 mAgs−1). The colored lines indicate the simulated evolution of each sulfur species as a function of specific capacity.

Simulated voltage profile using a kinetic model with a set of rate constants for discharge at the C/30 rate (1C = 1675 mAgs−1). The colored lines indicate the simulated evolution of each sulfur species as a function of specific capacity.