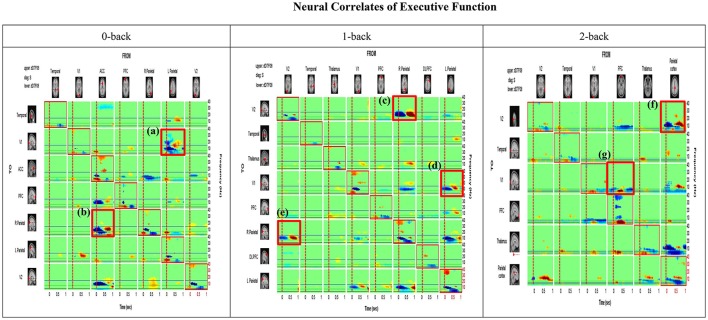
Figure 5.
Time-Frequency Grid. Each cell of the matrix shows the time-frequency distribution of information transfer between a respective pair of ICs (i.e., columns represent the source or FROM and rows represent destination or TO), with the highest information transfer indicated by warm colors. The frequency is on the y-axis and time on the x-axis on each cell of the matrix. The upper and lower triangles of the grid (i.e., above and below the red-bordered diagonal cells, respectively) represent the dDTF (conditional GC) between each pair of sources (e.g., Visual cortex 2  Visual cortex 1; Prefrontal cortex
 V2). Under the 0 back condition, the area (a) boxed in red [row 2, col 6] shows information flows at different times and frequencies from the source column 6 (Parietal) to the source row 2 (V1). The area (b) [row 5, col3] exhibits casual flow from the source column 3 (ACC) to the source row 5 (Parietal). On the other hand, under the 1 back condition, two boxed area (c) and (e) show bi-directional causal flows between V2 and right parietal cortex. The boxed area (d) indicates flows from the source column 8 (Left Parietal) to the source row 4 (V1). Lastly, under the 2 back condition, the boxed area (f) shows causal flows from the source column 6 (Parietal cortex) to the source row 1 (V2). The boxed area (g) presents information flows from the source column 4 (PFC) to the source row 3 (V1). The anatomical dipole locations for each source are rendered on the margins.

