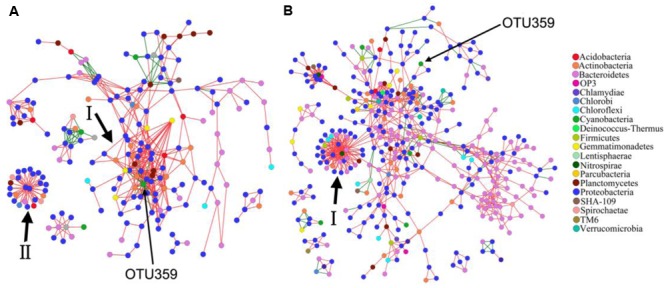
FIGURE 5.

Network interaction of OTUs in PAB (A) and FLB (B). Node of bloom-causing M. aeruginosa OTU 359 is marked with long arrows, and major modules are marked with short arrows and Roman numerals. Red lines indicate positive interactions, and green lines indicate negative interactions.
