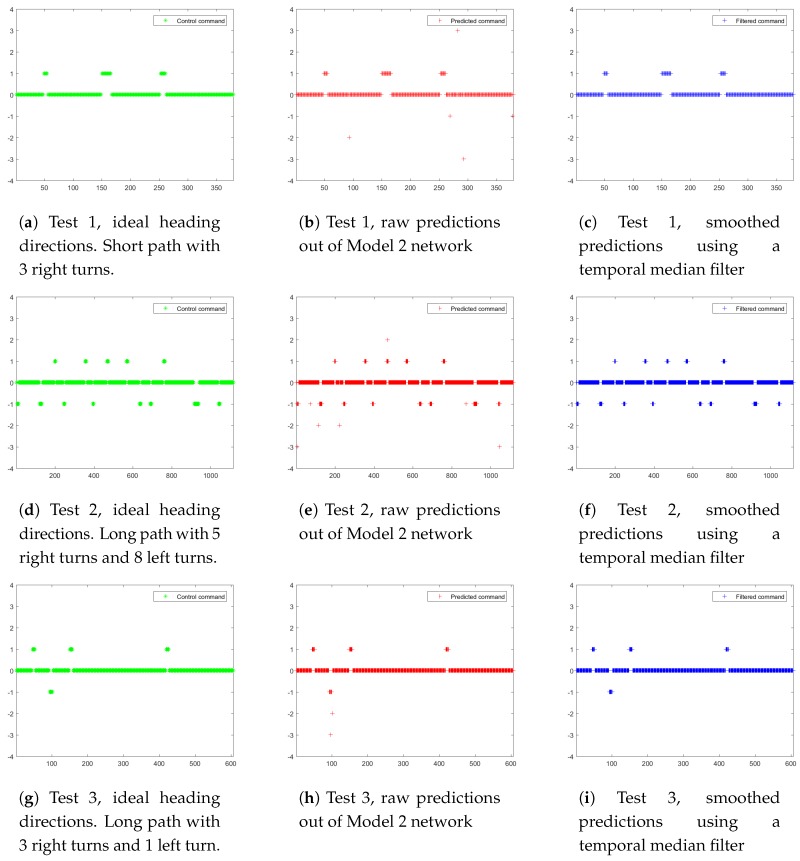
Figure 11.
Robot navigation heading directions in 3 separate tests. X-axis: frame index; Y-axis: heading direction choices (0, , , , positive values for right turns and negative values for left turns). (a,d,b) are manually labeled ideal heading directions; (b,e,h) are corresponding raw predictions from the proposed “Model 2” network; (c,f,i) are smoothed predictions using a temporal median filter of size 3.

