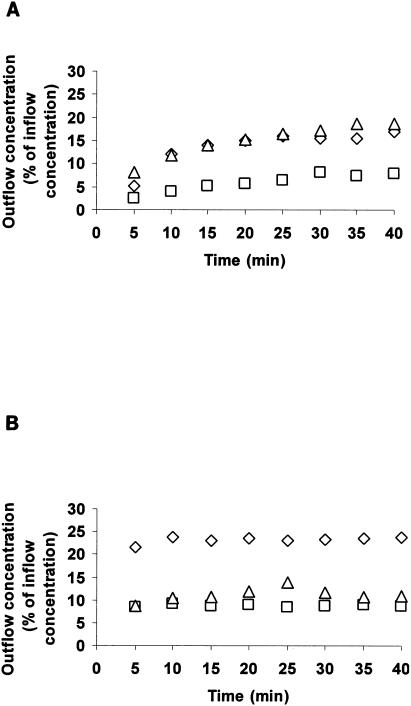
FIG. 1.
Typical profile of (A) maternal and (B) fetal outflow concentration as a function of time for indinavir (▵), vinblastine (□), and antipyrine (⋄). Plot of outflow concentration in the receiver circuit as a percentage of inflow concentration in the donor reservoir versus time for a representative placenta.

