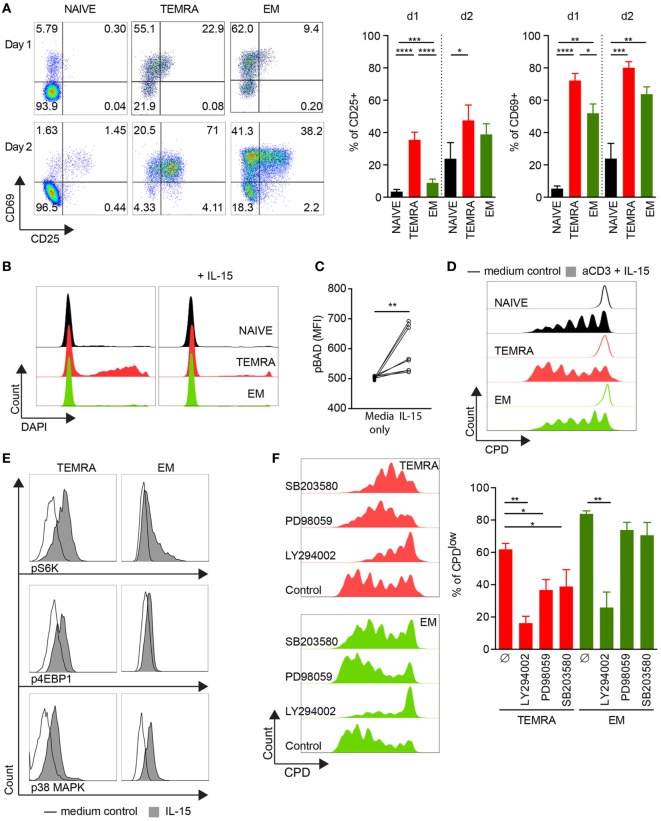
Figure 2.
IL-15 delivers pro-survival and proliferating signals to TEMRA CD8 dependent of PI3K/Akt, p38 MAPK, and pERK1/2 pathways. (A). Expression of CD25 and CD69 after 24 and 48 h of culture of purified CD8 subsets with plate-bound anti-CD3 (2 µg/mL) and IL-15 (10 ng/mL). Of note, neither CD25 nor CD69 could be detected on purified CD8 T cell subsets before anti-CD3 activation (data not shown). Representative flow data are shown, and bars indicate mean ± SEM of pooled data (n = 7–10). (B) Incorporation of DAPI after 48 h of culture of purified CD8 subsets with medium control (left panel) or with IL-15 (10 ng/mL; right panel). Representative flow data are shown (n = 9). (C) Peripheral blood mononuclear cells (PBMCs) were stimulated for 15′ with IL-15 (10 ng/mL) and phosphorylation of Bad (pS112) was analyzed within TEMRA CD8 T cells according to the mean fluorescent intensity. Each dot represents data obtained from cells isolated from one healthy volunteers (n = 8). (D) CPDeFluor405-labeled CD8 subsets were cultured for 5 days with plate-bound anti-CD3 (2 µg/mL) and IL-15 (10 ng/mL). Representative flow data are shown (n = 6). (E) PBMCs were stimulated for 15′ with IL-15 (10 ng/mL) or medium control and phosphorylation of p70 S6 Kinase (pT389), 4E-BP1 (pT37/46), and p-p38 MAPK (pT180/pY182) was analyzed within NAIVE, TEMRA, and effector memory (EM) CD8 T cells. Representative flow data are shown (n = 8). (F) Percentage of CPDeFluor405low cells after 5 days of culture of purified CD8 subsets with plate-bound anti-CD3 (2 µg/mL) and IL-15 (10 ng/mL) in the presence of medium control or selective inhibitors (LY294002, 10 µM; PD98059, 10 µM; SB203580, 10 µM). Representative flow data are shown and bars indicate mean ± SEM of pooled data (n = 5–7). Comparison between the three CD8 subsets was performed using Kruskal–Wallis test followed by a Dunn’s Multiple Comparison Test (A,F). Post hoc test was performed using the no-stimulation setting as reference for each CD8 subset (A, F) *p < 0.05, **p < 0.01, ***p < 0.001. Wilcoxon matched-pairs signed rank test was used to test the cytokine effect (C, no-stimulation setting as reference) *p < 0.05, **p < 0.01, ***p < 0.001, ****p < 0.0001.

