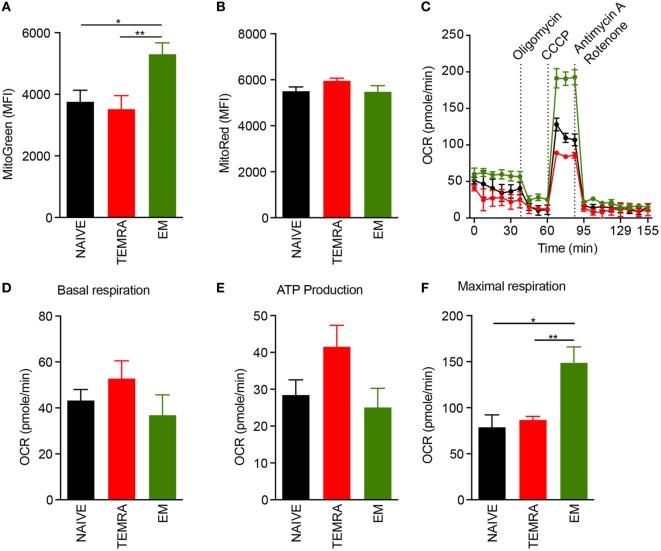
Figure 3.
TEMRA CD8 T cells exhibit polarized and functional mitochondria. (A,B) Mitochondrial load (A) and mitochondrial membrane potential (B) of each CD8 T cell subsets were assessed according to mean fluorescence intensity of Mitotracker Green and Red, respectively. Oxygen consumption rate (OCR) of purified CD8 T cell subsets was measured before and after sequential addition of metabolic stress drugs. (C) OCR profile of one out of 5 healthy volunteers. (D) OCR under resting settings of purified CD8 T cell subsets. (E) Oxygen consumption devoted to ATP production by mitochondria was assessed by comparing OCR before and after addition of oligomycin, an inhibitor of ATP synthase, to purified CD8 T cell subsets. (F) Maximal respiration of purified CD8 T cell subsets after addition of CCCP. Bars indicate mean ± SEM of pooled data (n = 5–13). Comparison between the three CD8 subsets was performed using Kruskal–Wallis test followed by a Dunn’s Multiple Comparison Test (*p < 0.05, **p < 0.01).

