Figure 5.
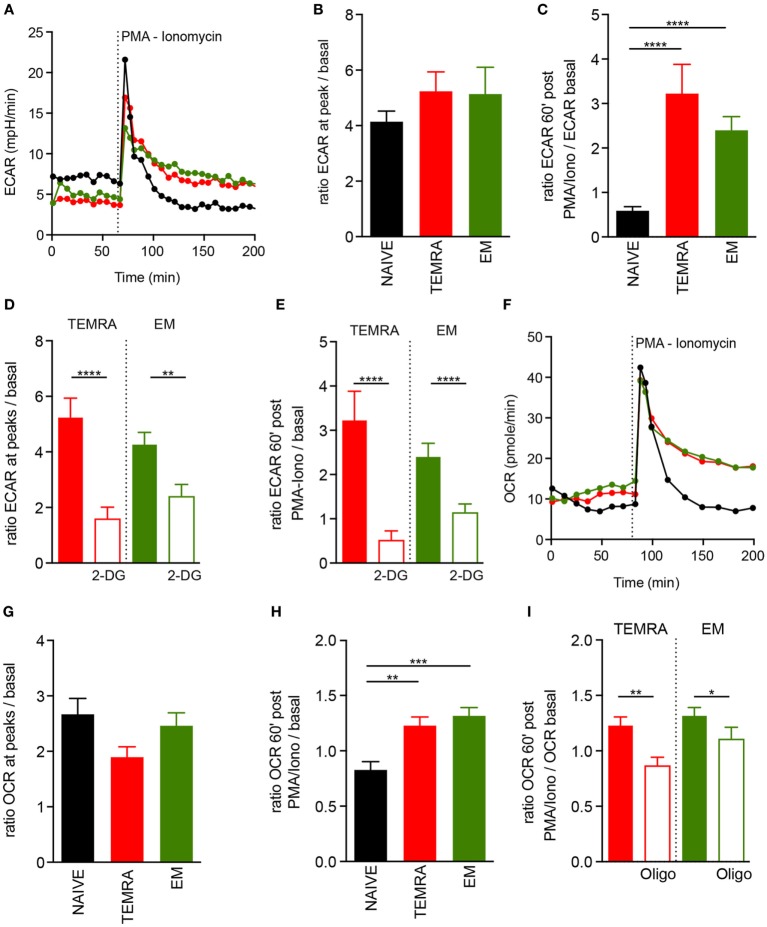
Fitness of metabolic adaptation of TEMRA CD8 T cells upon activation. (A–C) Extracellular acidification rate (ECAR) profile of one out of 14 healthy volunteer (HV) is shown [(A) NAIVE, black; TEMRA, green; effector memory (EM), red]. ECAR modification within each CD8 subset induced by PMA/Iono stimulation was assessed according to the ratio of extracellular acidification rate (ECAR) after/before drug injection [n = 14; (B)] and 60′ after/before drug injection [n = 14; (C)]. Glycolysis was inhibited by the provision of 2-DG before PMA/Iono stimulation and a similar readout was used [n = 11–14; (D,E)]. Oxygen consumption rate (OCR) of purified CD8 T cell subsets (NAIVE, black; TEMRA, green; EM, red) upon PMA/Iono stimulation was assessed, and 1 of 14 HV is shown (F). OCR modification within each CD8 subset induced by PMA/Iono stimulation was assessed according to the ratio of OCR after/before drug injection [n = 14; (G)] and 60′ after/before drug injection [n = 14; (H)]. Mitochondrial respiration was inhibited by provision of oligomycin before PMA/Iono stimulation and similar readout was used [n = 11–14; (I)]. Bars indicate mean ± SEM of pooled data (n = 11–14). Kruskal–Wallis test followed by a Dunn’s Multiple Comparison Test (B,C,G,H) and Mann–Whitney test (D,E,I) were performed (*p < 0.05, **p < 0.01, ***p < 0.001, ****p < 0.0001).

