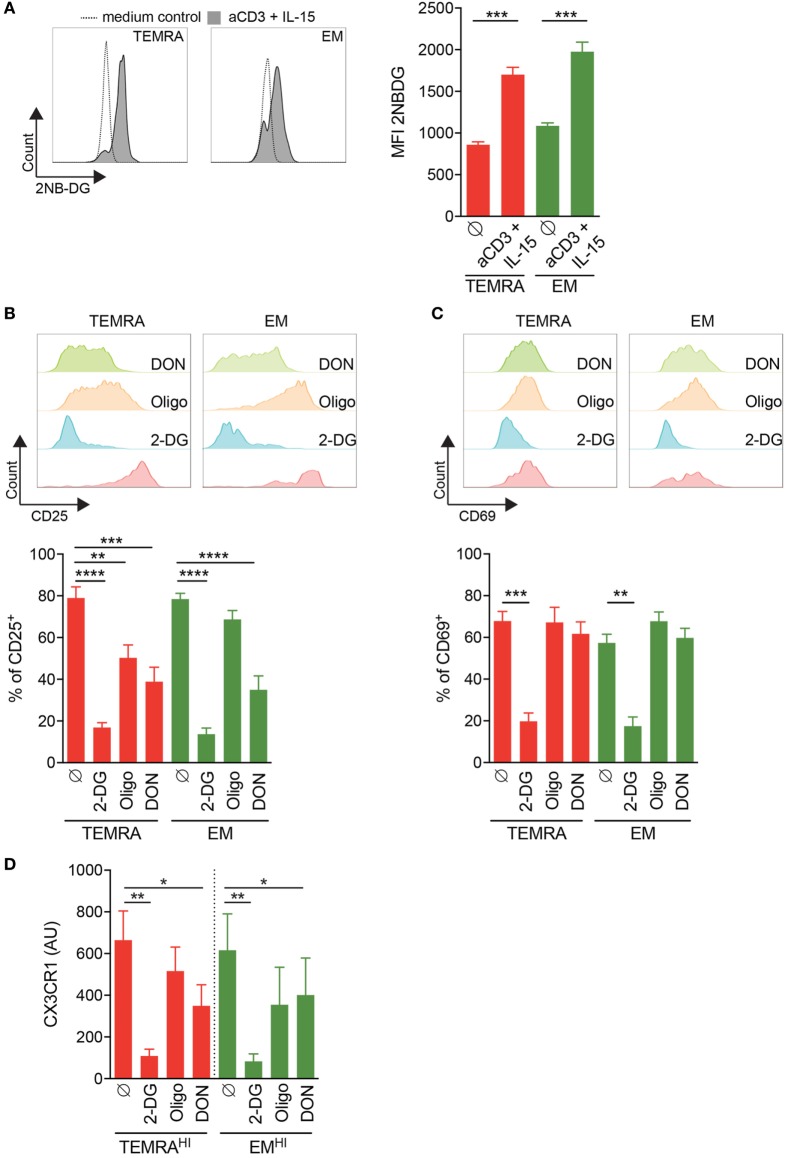
Figure 7.
Inhibition of IL-15 induced activation of TEMRA CD8 T cells from kidney-transplant (KT) recipients by interferences with glycolysis or glutaminolysis. (A) Uptake of 2-NBDG by CD8 T cell subsets purified from KT recipients stimulated for 24 h with plate-bound anti-CD3 (2 µg/mL) and IL-15 (10 ng/mL). Representative flow data are shown and bars indicate mean ± SEM of pooled data (n = 9). (B,C) Expression of CD25 or CD69 by CD8 T cell subsets purified from KT recipients stimulated for 24 h with plate-bound anti-CD3 (2 µg/mL) and IL-15 (10 ng/mL) in the presence of 2-DG, oligomycin, DON, or control medium. Representative flow data are shown and bars indicate mean ± SEM of pooled data (n = 10–12). (D) 2-DG, oligomycin, or DON was added during the overnight stimulation of CD8 T cell subsets from KT before the coculture of human umbilical vein endothelial cell with supernatant from IL-15-activated CD8 T cell subsets. Bars indicate mean ± SEM of pooled data (n = 4–6). Mann–Whitney test or Kruskal–Wallis test followed by a Dunn’s Multiple Comparison Test were performed (*p < 0.05, **p < 0.01, ***p < 0.001, ****p < 0.0001).

