Fig. 3.

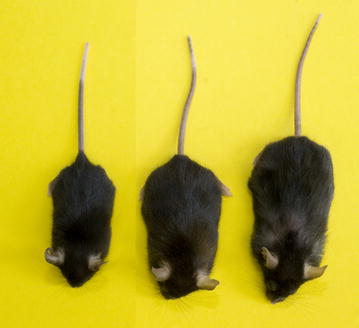
Mouse models of GH excess and deficiency. Size comparison of the GHR knockout mouse (left), wild-type C57BL/6J mouse (center) and the bGH mouse (right)

Mouse models of GH excess and deficiency. Size comparison of the GHR knockout mouse (left), wild-type C57BL/6J mouse (center) and the bGH mouse (right)