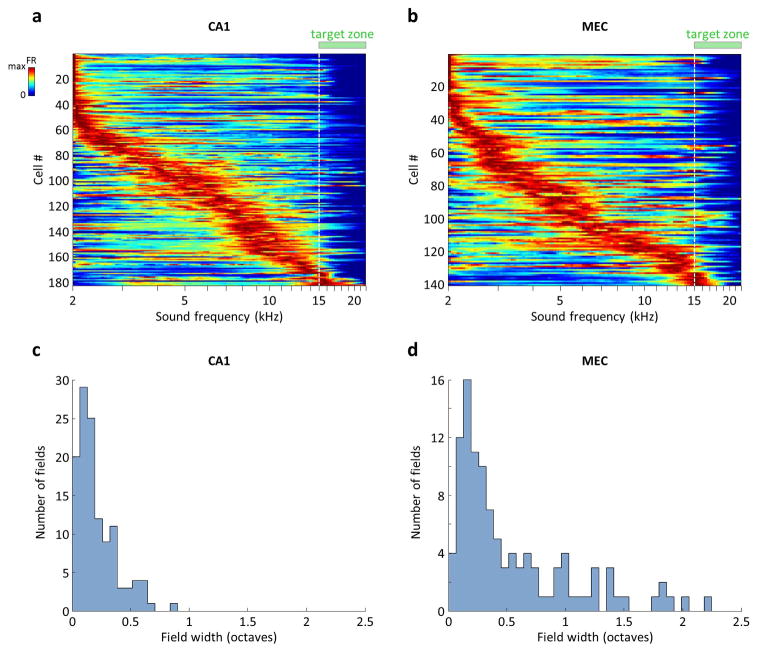
Extended Data Figure 6. CA1 and MEC cells form sequences of activity along the sound frequency axis.
a) Firing rates of all 183 CA1 cells with at least one firing field in the SMT that was confined to the sound presentation period (between the press and the release of the joystick). Each row corresponds to one cell and is normalized by the maximum firing rate during the sound presentation period. Rows are sorted according to the frequency at which the maximum firing rate occurred. Each trial was binned into 150 frequency bins, which could vary in duration both within a trial and across trials. The firing rate was calculated separately in each bin using that bin’s duration, the firing rates were averaged across trials and smoothed with a 3-point square window. Note that fields in the SMT did not progressively broaden during the delay period, as they typically do in time cells; this may be due to the fact that an informative sensory variable (sound frequency) was always available to the animal, preventing a drift in the neural code. b) Firing rates of 141 MEC cells, calculated and plotted as in (a). c) Distribution of CA1 firing field widths, only for those 122 cells that were identified as “frequency-aligned” by the electrophysiology model (Extended Data Fig. 8). Note that the entire trial was on average 3.1 octaves. d) Distribution of 109 MEC firing field widths, plotted as in (c). Note that the longer tail compared to the CA1 data is partially due to grid cells from modules with wide spacing (Fig. 4e).

