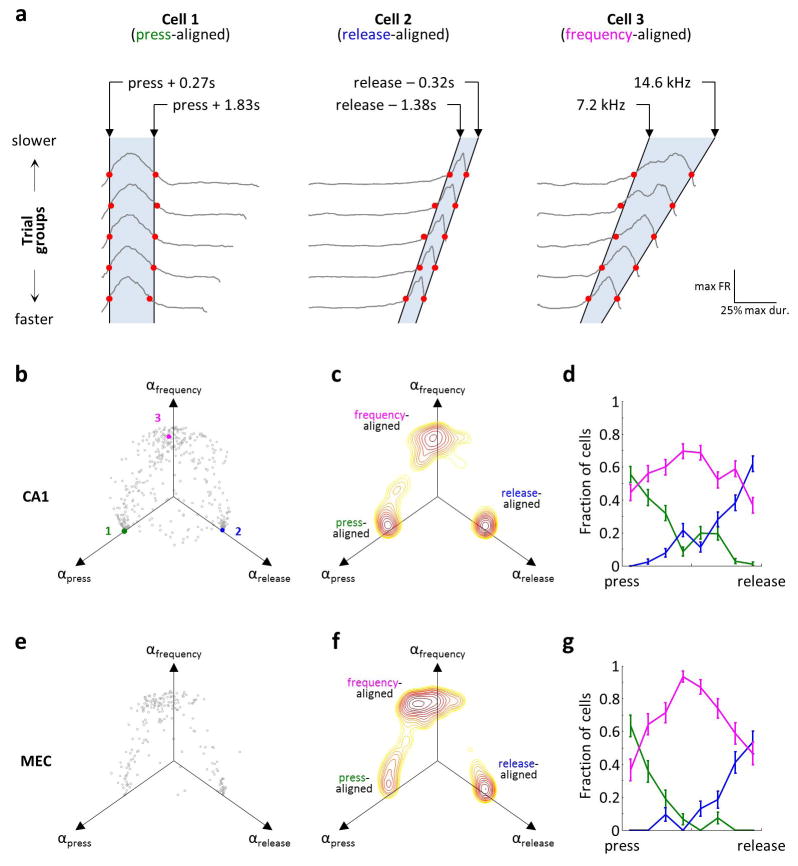
Extended Data Figure 8. Activity aligns to different task features in the SMT.
a) Traces: PSTHs across trials, sorted by duration into 5 groups. Each PSTH is normalized to its maximum. Red dots: 30% of maximum. Black lines: values of joystick press-aligned time tpress (cell 1), joystick release-aligned time trelease (cell 2) or sound frequency f (cell 3) that best fit the red symbols. These fits are for illustration purposes; the actual model maximized the cross-correlation of PSTHs by aligning them to a linear combination of tpress, trelease, and f. Cells shown are the same as in Extended Data Fig. 7. b) Fits of the model to all firing fields produced CA1 neurons. Axes are coefficients indicating the relative contribution of tpress, trelease, and f to the optimal alignment of PSTHs. c) Contour plot of the density of points in (b), illustrating 3 clusters. d) Distribution of fields belonging to each of the 3 clusters in (c) throughout the task. Time is linearly warped between the press and the release of the joystick. Error bars: 95% multinomial confidence intervals. Across all 411 fields from 341 recorded CA1 neurons with a peak of a firing field occurring during the sound presentation period, press-aligned, release-aligned, and frequency-aligned fields accounted for 26%, 23% and 51% of the population, respectively. (e–f) Same plots as in (b–d), but for 213 firing fields produced by 186 MEC neurons. In MEC, there was a larger fraction of frequency-aligned fields (17%, 20% and 63% for the three types; p<0.01 χ2 test for comparison to CA1). The three clusters in were not perfectly separated; in fact, some firing fields had significantly non-zero regression coefficients for more than one task parameter: 14% in CA1 and 21% in MEC (p<0.01, bootstrap analysis).

