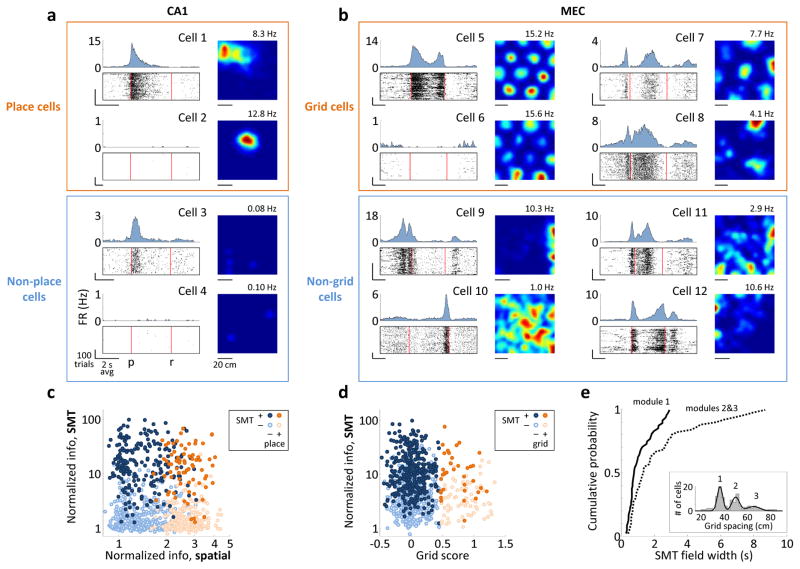
Figure 4. SMT-modulated and spatially-modulated cells overlap.
a) Activity of CA1 cells in the SMT (left), plotted as in Fig. 3. Right: spatial firing rate maps for random foraging; the maximum firing rate is indicated. Cells 2 and 4 were silent in the SMT; cells 3 and 4 were silent during foraging. All firing rate scales are from 0 Hz to the nearest integer number of Hz above the maximum firing rate. FR: firing rate; p: press; r: release. b) Activity of MEC grid cells in the two tasks. Cells 5 and 6 are from module 1 in the same rat and are plotted on the same firing rate scale. Only cell 5 was active in the SMT. Cells 7 and 8 are from modules 2 and 3, respectively. Cell 9 is a border cell. c) Normalized information of all 918 CA1 cells during the SMT, as in Fig. 3, plotted against normalized spatial information – the mutual information between spikes and the location, divided by the average value from samples with shuffled spike timing. Points are colored and shaded according to whether the cell was a place cell and whether it was SMT-modulated. Information values in the two tasks are not expected to be similar due to different task structures. d) Normalized information of all 881 MEC cells during the SMT task plotted against the cells’ grid scores. Points are colored and shaded according to whether the cell was a grid cell and whether it was SMT-modulated. e) Cumulative histograms of the average field width for all 48 grid cells in module 1 and all 51 grid cells in modules 2/3. Groups were separated at 42 cm. Inset: Distribution of grid spacings across cells and a mixture of 3 Gaussians fit to the distribution. Peaks corresponding to modules 1–3 are numbered.

