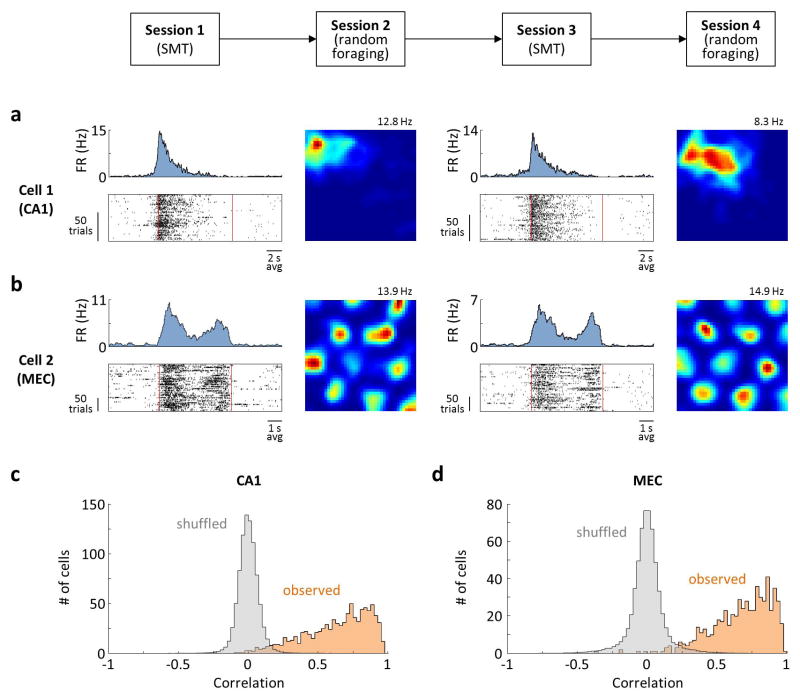
Extended Data Figure 3. Stability of firing.
a) Activity of a CA1 place cell on interleaved SMT and random foraging sessions. Data are plotted as in Fig. 4. Sessions immediately followed one another. Sessions 1 and 3 were 30 min long each, while sessions 2 and 4 were 15 min long each. b) Activity on an MEC grid cell, plotted as in (a). Sessions 1 and 3 were 1 h long each, while sessions 2 and 4 were 20 min long each. Session 2 and 4 immediately followed sessions 1 and 3, respectively. The starts of sessions 1 and 3 were separated by 24 h. c) Summary of the stability across all 882 SMT-modulated CA1 cells. For each cell, the Pearson correlation is measured between the PSTHs from the first halves of the SMT sessions and the second halves of the sessions. Orange: distribution of correlation values across cells. Gray: distribution of correlation values computed after shuffling spike times, averaged across 100 shuffles. d) Summary of the data from 597 MEC cells, plotted as in (c). In CA1 and MEC, 95.7% and 97.2% of the cells has higher correlation values than in the shuffled data (p<0.01), respectively.

