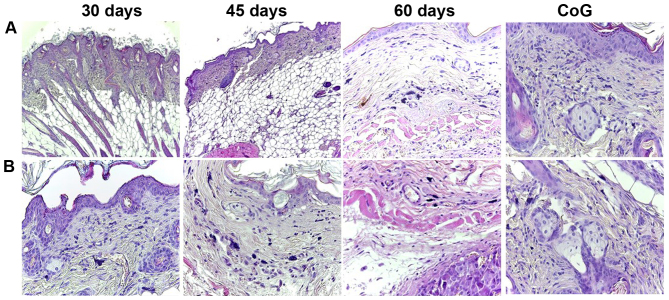
Figure 7.
Specimens of the skin (A) surrounding and (B) around the tumor: the number of mast cells increased from the control group to the mice sacrificed at 60 days after inoculation, and the distribution of mast cells varied from the superficial dermis in the first group (30 days) to the deep dermis and subcutis in the last group (60 days), H&E staining. CoG, control group.

