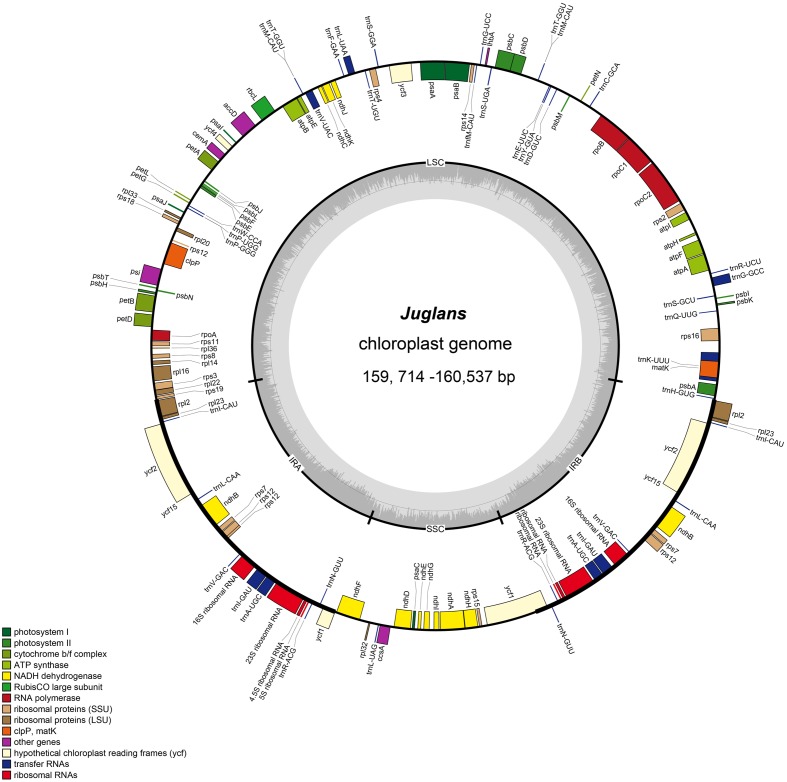
FIGURE 1.
Gene map of Juglans chloroplast genome. The genes inside and outside of the circle are transcribed in the clockwise and counterclockwise directions, respectively. Genes belonging to different functional groups are shown in different colors. The thick lines indicate the extent of the inverted repeats (IRa and IRb) that separate the genomes into small single-copy (SSC) and large single-copy (LSC) regions.

