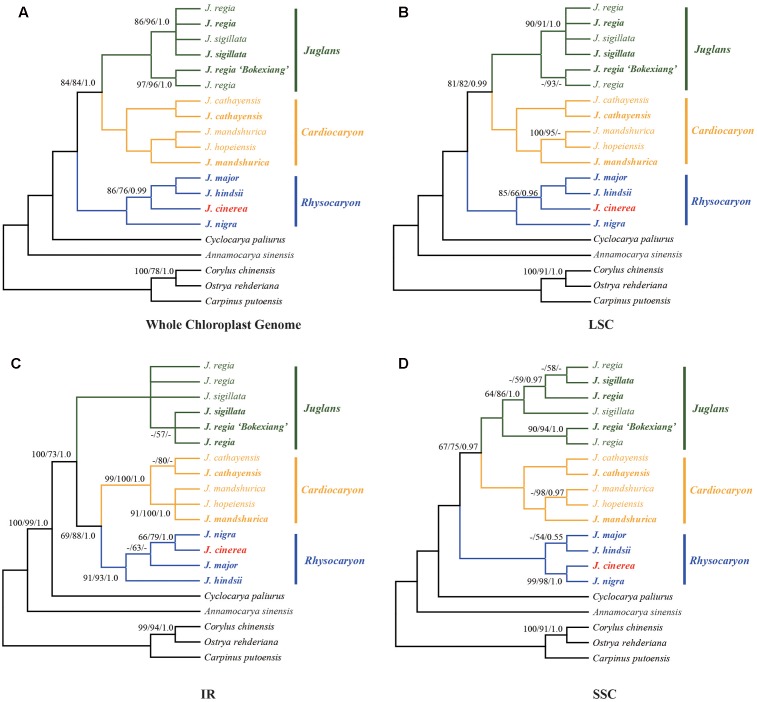
FIGURE 3.
Phylogenetic relationships of Juglans inferred from maximum parsimony (MP), Bayesian inference (BI), and maximum likelihood (ML) analyses of different chloroplast genome data partitions. (A) Whole chloroplast genome. (B) LSC region. (C) IR region. (D) SSC region. Numbers near nodes indicate the MP bootstrap values (left) for each clade present in the 50% majority-rule consensus, ML bootstrap values (middle), and Bayesian posterior probability (right). Both MP and ML bootstrap support values = 100 and Bayesian posterior probability = 1.0 are not given at the nodes.

