FIGURE 1.
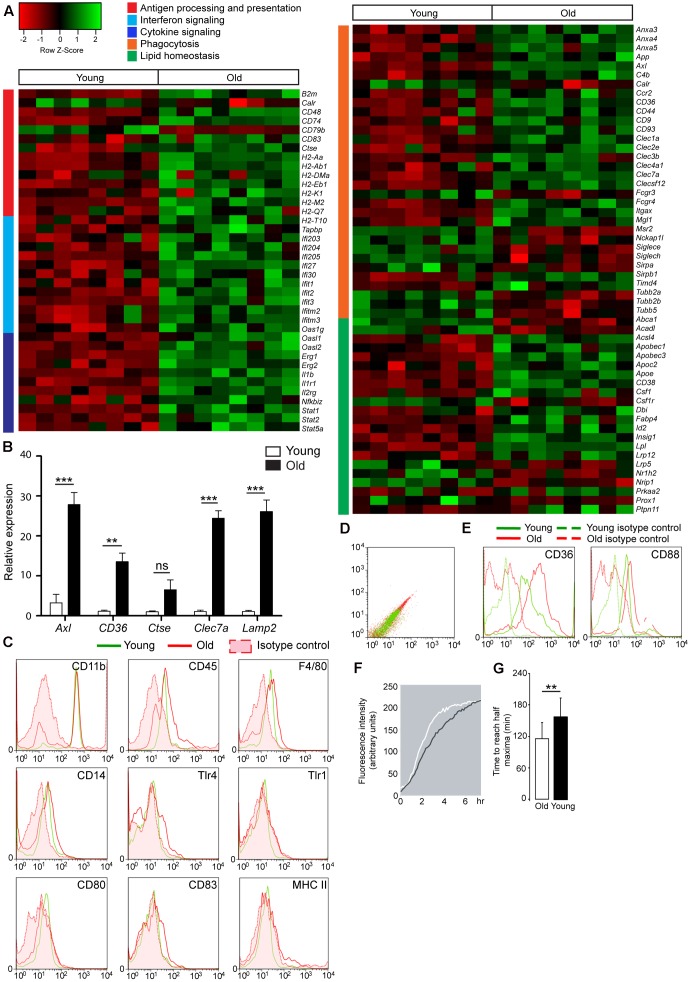
Gene expression change and increased phagocytic capacity in aged microglia, compared to young microglia. (A) Heatmap of pro-inflammatory genes in aged microglia vs. young mouse microglia. Functional annotation reveals genes upregulated in aged microglia to be involved in antigen processing and presentation (red cluster), interferon signaling (light blue cluster) and cytokine signaling (dark blue cluster) (n = 8); Heatmap of genes involved in phagocytosis (orange cluster) and lipid homeostasis (green cluster) in aged microglia vs. young microglia (n = 8); (B) Quantitative PCR validation of phagocytic genes in sorted microglia from young (white bars) and aged (black bars) mouse brain (n = 4 young; n = 6 old); HMBS was used as the housekeeping gene. Asterisks ∗ indicate comparisons, for which P-value was values indicated according to Student’s t-test, ∗∗P < 0.005, ∗∗∗P < 0.0005, ns, not significant. Error bars indicate standard deviation (SD). (C) After purification, gated cells are CD11b high, CD45 intermediate, and F4/80 positive microglia. Antigen presenting molecules, CD14, Tlr4, Tlr1, CD80, CD83, and MHC II, are not higher expressed at the protein level in aged microglia (n = 5); (D) Increased autofluorescence of aged microglia; (E) Lipid-related scavenger receptor CD36 and complement receptor CD88 are found to be upregulated in aged microglia (red) compared to young microglia (green) and higher than the corresponding isotype controls and autofluorescence values (derived from unstained cells) (n = 5); (F) The phagocytic capacity of acutely isolated microglia was investigated by means of live cell imaging using pHrodo coupled to bacterial particles (n = 4); (G) Quantification of the time to reach half maxima during phagocytic response of acutely isolated microglia from young and aged mouse brains. The aged microglia need less time to reach the half maxima. Each depicted experiment is representative of four independent experiments that yielded similar results. Student’s t-test ∗∗P < 0.005, Error bars indicate standard deviation.

