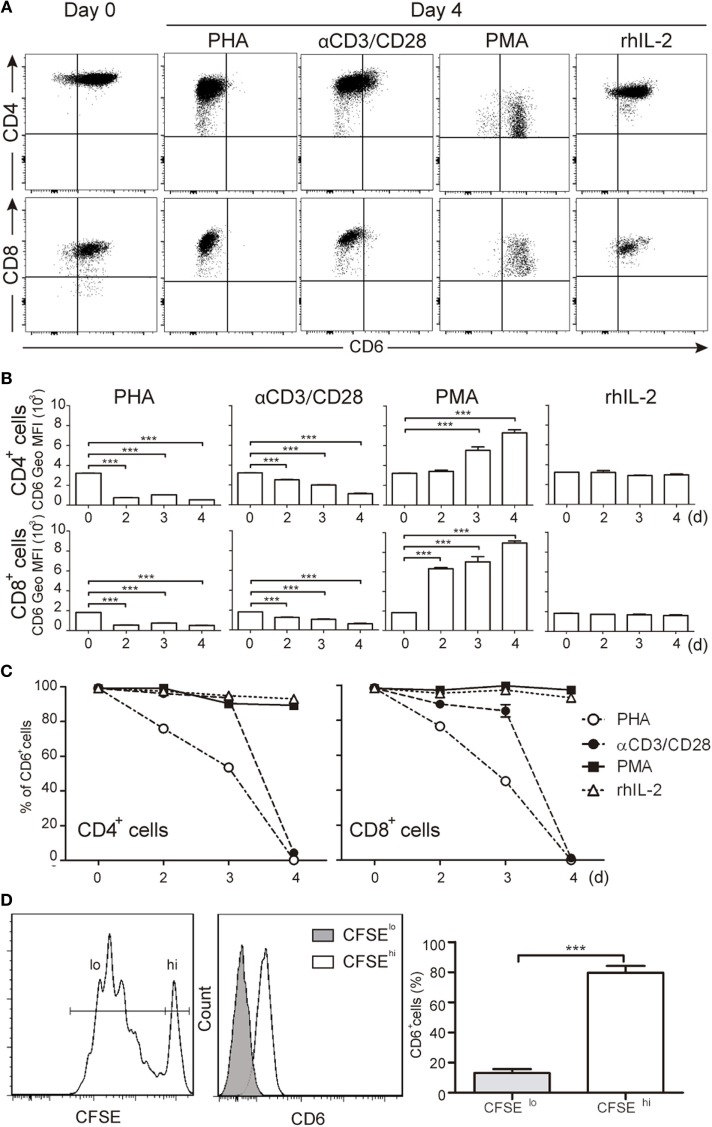
Figure 1.
Downregulation of CD6 surface expression in response to different T-cell receptor-mediated activation stimuli. (A–C) PBLs (105/well) were cultured for 4 days in the presence of PHA (5 μg/mL), αCD3/CD28 beads (2 μL/105 cells), PMA (10 ng/mL), or rhIL-2 (10 ng/mL). Cells were then stained with labeled specific mAbs for CD3 (UCHT1), CD4 (MT310), CD8 (SK1), and CD6 (M-T605) and analyzed by flow cytometry at different days (d). (A) Representative dot plots of CD6+ cells in the CD3+CD4+ (top panel) or CD3+CD8+ (bottom panel) subsets at days 0 and 4 post-stimulation. (B) Bar chart representing mean ± SD of geometric mean of fluorescence intensity (Geo MFI) values for CD6 expression on CD3+CD4+ (top panel) and CD3+CD8+ (bottom panel) cells over time post-stimulation, from three independent experiments. (C) Line chart representing the percentage of CD6+ cells over time post-stimulation in the CD3+CD4+ (left hand) or CD3+CD8+ (right hand) subsets from three independent experiments. (D) Staphylococcal enterotoxin B-pulsed mature DCs (2 × 10³/well) co-cultured with CFSE-labeled PBL (105/well) for 5 days were analyzed for CD6 expression on proliferating (CFSElo) and non-proliferating (CFSEhi) cells. Left, representative histogram of CD6 expression on CFSElo and CFSEhi cells is. Right, bar chart representing percent (mean ± SEM) of CD6+ cells in the CFSElo and CFSEhi subsets from 10 independent experiments. ***p < 0.001 (unpaired t test).

