Figure 3.
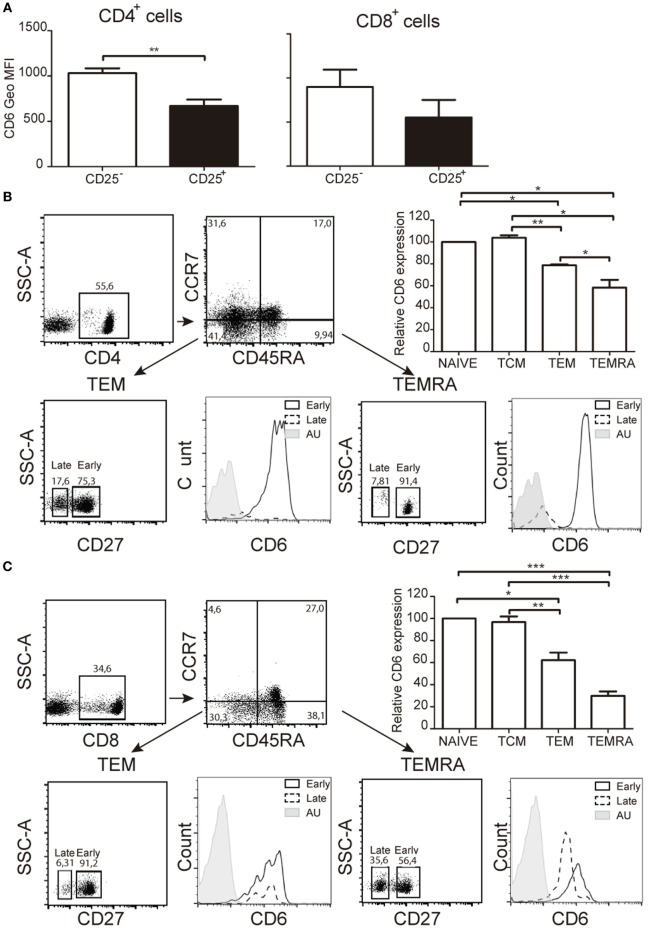
Ex vivo analysis of CD6 surface expression on peripheral T cells with activated or memory phenotypes. (A) Bar chart representing geometric mean of fluorescence intensity (Geo MFI) (mean ± SEM) of CD6 surface expression on CD25− and CD25+ peripheral CD4+ (left hand side) and CD8+ (right hand side) T cells from healthy donors (n = 4). (B) Analysis of CD6 surface expression of peripheral CD4+ T cells from healthy donors with naïve (CD45RA+CCR7+), central memory T cell (CD45RA−CCR7+), effector memory T cell (TEM) (CD45RA−CCR7−), and TEMRA (CD45RA+CCR7−) phenotypes. A representative dot plot of the gating strategy used is shown (top left). The bar chart shows the relative CD6 surface expression on the indicated subsets from five different donors (top right). Data represent the percent (mean ± SEM) increase/reduction of Geo MFI values for each subset considering 100% the values for naïve T cells. *p < 0.05; **p < 0.01; ***p < 0.001 (unpaired t test). Lower panel, CD6 surface levels on late (CD27lo/−) and early (CD27hi) CD4+ TEM (left), and TEMRA (right) cells. AU, autofluorescence. (C) Same as in (B) but for CD8+ peripheral T cells.

