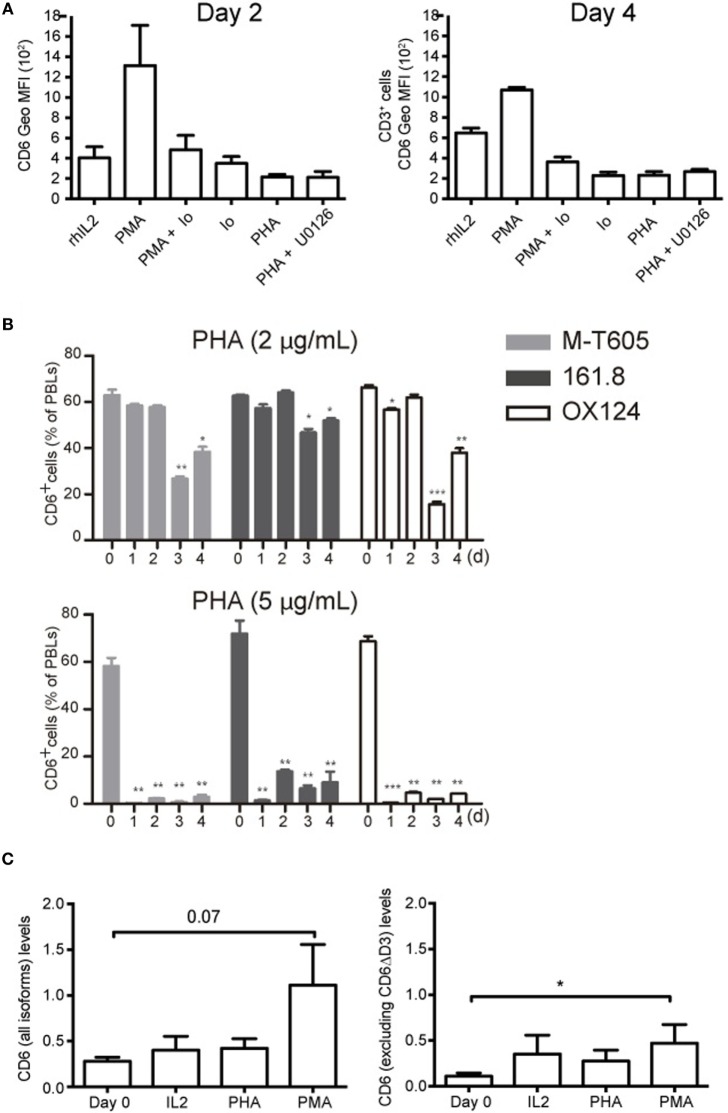
Figure 4.
CD6 down-modulation is dependent on Ca2+ influx and does not involve differential utilization of extracellular CD6 isoforms nor changes in CD6 mRNA levels. (A) PBL (2 × 10⁵/well) was cultured for 2 (left) or 4 (right) days in the presence of rhIL-2 (10 ng/mL) alone, or together with PMA (10 ng/mL), PMA (10 ng/mL) plus Ionomycin (0.7 μg/mL), Ionomycin (0.7 μg/mL), PHA (5 μg/mL), and PHA plus U0126 (10 μM). Cells were stained with labeled mAb for CD3 (UCTH1) and CD6 (M-T605) and analyzed by flow cytometry. Shown is a bar chart representing the mean ± SD of geometric mean of fluorescence intensity (Geo MFI) values for CD6 expression. (B) PBLs (105/well) cultured for 3 days in the presence of 2 μg/mL (top panel) or 5 μg/mL (bottom panel) of PHA were analyzed by flow cytometry for CD6 surface expression with either FITC-labeled M-T605 mAb or unlabeled OX124 and 161.8 mAb plus FITC-labeled goat anti-mouse Ig. Bars represent the percent (mean ± SEM) of CD6+ PBL at different time points following exposure to PHA, from three independent experiments performed. Comparisons were made with values at day 0. *p < 0.05; **p < 0.01; ***p < 0.001 (unpaired t test). (C) Reverse transcription PCR analysis of CD6 mRNA levels following 24 h stimulation of PBMC with PHA (5 μg/mL), PMA (10 ng/mL), or rhIL-2 (10 ng/mL). Left, results obtained with an exon 1–2 boundary-specific probe. Right, results obtained with an exon 5–6 boundary specific. Data are presented as mean ± SD (n = 4). *p < 0.05 (Student’s t-test).

