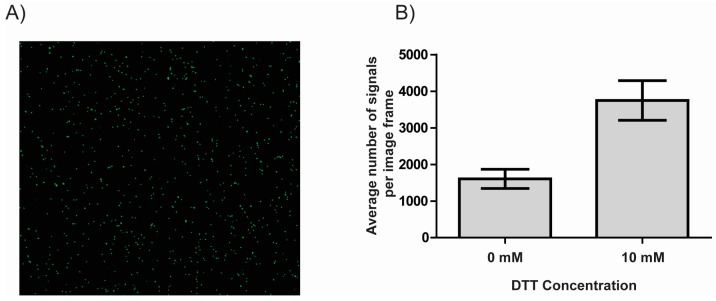
Figure 2.
DTT mediated immobilization of double stranded DNA. (A) Representative image of immobilized fluorescent DNA molecules visualized using fluorescence microscopy; (B) Bar chart showing the results of exposing an NHS-ester modified microscopy slide to fluorescently labelled linear DNA either in the absence of DTT or in the presence of 10 mM DTT. Immobilized DNA molecules were visualized using fluorescence microscopy and quantified using ImageJ. The results shown are the number of DNA molecules visible per image frame. Error bars represent the standard error of mean (n = 6).

