
Fig. (10).
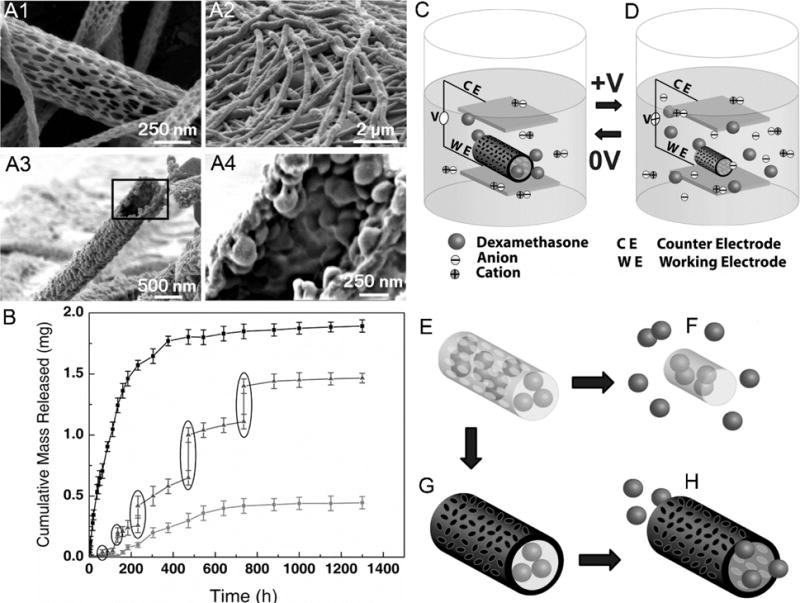
SEM images of (A1) PLGA nanofibers, (A2) PEDOT coated PLGA nanofibers, (A3) PEDOT nanotubes after removing PLGA by DCM, and (A4) magnified image of (A3). (B) Cumulative mass release of DEX from: PLGA nanofibers (top line), PEDOT-coated PLGA nanofibers (bottom line) without electrical stimulation, and PEDOT-coated PLGA nanofibers with electrical stimulation of 1 V applied at the five specific times indicated by the circled data points (middle line). (C, D) Schematic illustration of the electrical field induced the release of DEX. Schematic illustration of (E) DEX-loaded electrospun PLGA nanofibers, (F) hydrolytic degradation of PLGA nanofibers leading to the release of DEX, (G) electrochemical deposition of PEDOT on the DEX-loaded electrospun PLGA nanofibers, and (H) the release of DEX from PEDOT-coated and DEX-loaded PLGA nanofibers. (Reprinted from ref.[148])