Fig. 5.

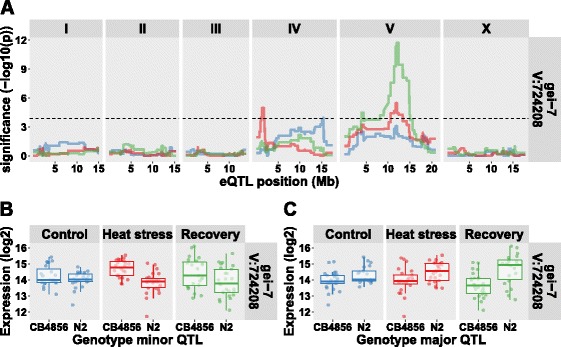
The trans-eQTL of gei-7. a The eQTL patterns for gei-7, the x-axis shows the position along the chromosomes and the y-axis the significance of the association. The horizontal dashed line indicates the FDR ≤ 0.05 (−log10(p) > 3.9). Colors indicate the three treatments (control, blue; heat stress, red; recovery, green). b The genotype effects split out at the minor heat stress QTL (chromosome IV). c The genotype effects split out at the major QTL (chromosome V)
