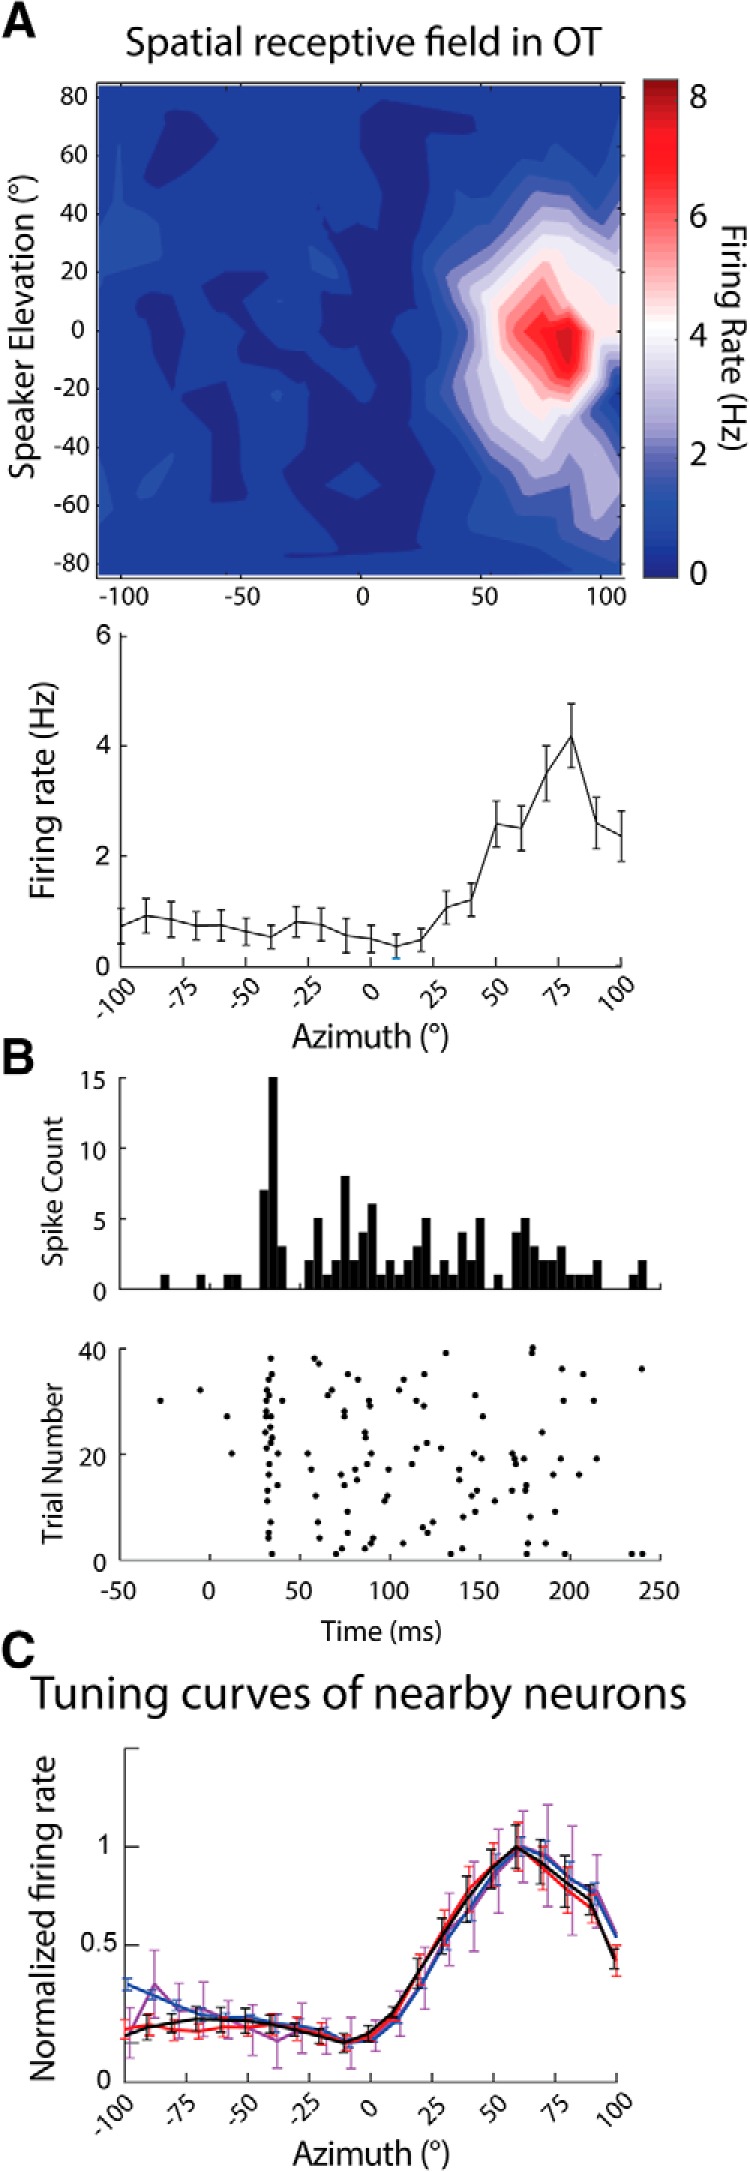
Figure 2.

Azimuth tuning of nearby neurons in OT. A, Spatial receptive field (SpRF) (top) and azimuth tuning curve (bottom) obtained by averaging the SpRF across elevation. B, Peristimulus time histogram (PSTH; top) and raster (bottom) for the spiking activity of the neuron in A responding to sound at the preferred direction (90° azimuth and 0° elevation). C, Example azimuth tuning curves of neurons recorded from the same site. Responses are normalized to facilitate visual comparison. Tuning curves represent mean ± SEM, 20–40 repetitions.
